Today’s cloud-based applications have a growing number of use cases that require a frequent, scalable and reliable use of Data Analytics tools. Thankfully, the number of tools in the market is wide and the level of maturity and array of features these tools offer is also very useful.
In this article, I will focus on two popular Data Analytics tools: Starburst Enterprise and a known Lakehouse platform based on Apache Arrow. I’ll focus on deploying these tools on AWS infrastructure and cover areas such as performance, infrastructure setup and maintenance. Similarly to previous articles, the main question to answer is: “What do I need to do in order to run this workload, how fast will it be and how much will I pay for it?”
- Starburst Enterprise is a commercial distribution of Trino (formerly known as PrestoSQL) It can query data stored in multiple data sources (e.g. AWS S3, Hadoop, SQL and NoSQL databases, Google Cloud Storage, etc.)
- Data analytics platform based on Apache Arrow and with a focus on a Data Lake approach, which delivers the ability to access multiple data sources and query data in those sources from a central platform. Similar to Starburst, it supports data sources such as S3, relational databases, Google Cloud Storage and HDFS, among others.
Both platforms are available in the AWS Marketplace, which is the approach I followed to launch the AWS infrastructure for this set of tests.
Data and Infrastructure Setup
Below are the setup details I followed for both Starburst and the Lakehouse platform in order to execute these tests.
Data
- Tests follow the TPC-H and TPC-DS benchmarks, which consist of a data set and queries created by the Transaction Processing Performance Council (TPC). When it comes to evaluating performance across data analytics tools and databases, both benchmarks are considered an industry standard.
- I used two 1TB TPC data sets (TPC-H and TPC-DS) in Parquet format, stored in AWS S3. Data for TPC-H and TPC-DS was originally created in ORC format using Starburst TPC connector and then converted to Parquet format using the Lakehouse platform’s CTAS feature.
- The TPC-DS data set contains approximately 6.35 billion records stored in 24 tables, while TPC-H contains approximately 8.66 billion records stored in 8 tables. TPC-H consists of 22 SQL queries, while TPC-DS consists of 99 queries. For this test, the following TPC-DS tables were partitioned as described below:
- catalog_returns on cr_returned_date_sk
- catalog_sales on cs_sold_date_sk
- store_returns on sr_returned_date_sk
- store_sales on ss_sold_date_sk
- web_returns on wr_returned_date_sk
- web_sales on ws_sold_date_sk
I used the same TPC-DS dataset as in my previous article comparing Starburst Enterprise vs. AWS EMR.
Infrastructure
- For Starburst Enterprise to access data, it is required to launch a Hive Metastore. This was done using AWS EMR v.6.2.0 (Hive 3.1.2), using an m4.large EC2 instance and backed by a db.t3.medium AWS RDS DB instance running MySQL 5.7.22. I set up this Hive Metastore using the steps described in the AWS documentation.
- I used Starburst Enterprise 370-e, which is available in the AWS Marketplace and launched the cluster using the CloudFormation template available there. The template allows users to configure compute and storage capacity as well as custom configurations (i.e. memory allocation, metastore location, etc.). The stack creates an Auto Scaling Group to manage the launched EC2 instances.
- I used the Lakehouse platform available in the AWS Marketplace and applied default configurations. The CloudFormation stack launches a coordinator EC2 instance, which allows users to specify data sources and other cluster configurations, such as instance types and number of coordinators and executors. For this platform, I included two scenarios for each data set: 1) local caching enabled, 2) local caching disabled. Even though enabling cache is expected to deliver better performance, there are data sets or scenarios where caching is not necessarily the desired option. For example, when querying data that is not accessed regularly or when querying data that is updated frequently.
- Both clusters consisted of 20 executors/workers and 1 coordinator node, all running on m5d.8xlarge EC2 instances for the Lakehouse platform and m5.8xlarge for Starburst.
Benchmark Executions
For each benchmark, the corresponding queries (TPC-H/TPC-DS) were executed sequentially and each query set was executed 4 times. The numbers reported are the average of these 4 sequential executions. This resulted in the following scenarios:
- 4 sequential sets of 22 TPC-H queries using Starburst Enterprise (no cache) and the Lakehouse platform default data source cache configuration (“Enable local caching when possible” enabled from Advanced Options in datasource screen)
- 4 sequential sets of 99 TPC-DS queries using Starburst Enterprise (no cache) and the Lakehouse platform default data source cache configuration (“Enable local caching when possible” enabled from Advanced Options in datasource screen)
- 4 sequential sets of 22 TPC-H queries unchecking “Enable local caching when possible” in the Lakehouse platform.
- 4 sequential sets of 99 TPC-DS queries unchecking “Enable local caching when possible” in the Lakehouse platform.
Each scenario was executed on a recently launched, fresh cluster. I ran ANALYZE statements to collect table/column statistics for each of the 24 tables that are part of the TPC-DS test and the 8 tables in TPC-H. It’s also important to mention that this is not an official, audited benchmark by TPC.
TPC-H 1TB Parquet - Performance Comparison
| qid | Starburst 370-e | LH - cache | LH - no-cache |
|---|---|---|---|
| q01 | 14 | 14 | 24 |
| q02 | 10 | 17 | 26 |
| q03 | 15 | 10 | 24 |
| q04 | 8 | 9 | 19 |
| q05 | 16 | 16 | 31 |
| q06 | 6 | 3 | 11 |
| q07 | 12 | 11 | 23 |
| q08 | 15 | 16 | 37 |
| q09 | 40 | 25 | 46 |
| q10 | 15 | 11 | 29 |
| q11 | 3 | 5 | 9 |
| q12 | 13 | 12 | 17 |
| q13 | 13 | 9 | 13 |
| q14 | 10 | 3 | 12 |
| q15 | 13 | 5 | 18 |
| q16 | 6 | 7 | 15 |
| q17 | 27 | 22 | 51 |
| q18 | 40 | 16 | 32 |
| q19 | 12 | 6 | 13 |
| q20 | 12 | 6 | 16 |
| q21 | 35 | 87 | NA |
| q22 | 4 | 4 | 11 |
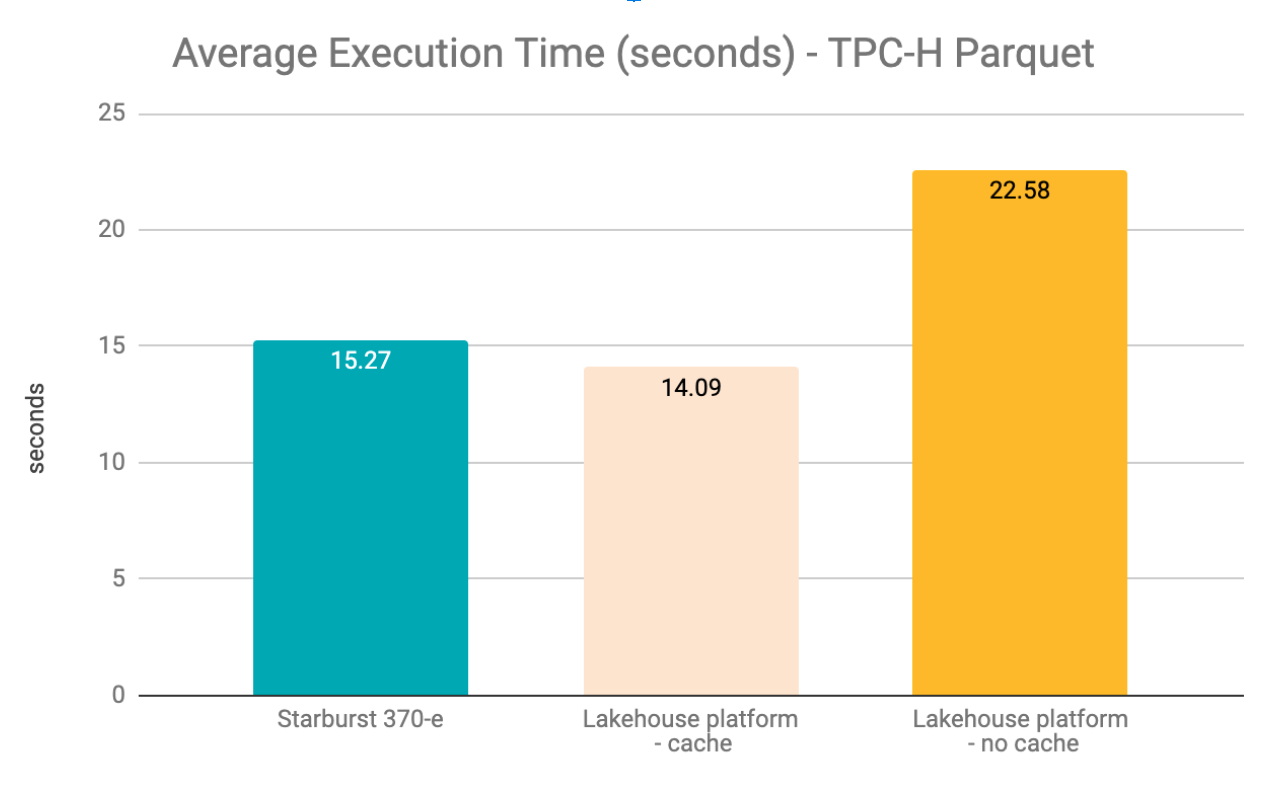
| Avg | 15.27 | 14.09 | 22.58 |
| Max | 40.25 | 87.00 | 51.25 |
| Min | 3.00 | 3.00 | 8.75 |
The table below shows the average query execution time relative to each engine, as a percentage.
| relative to: | |||
|---|---|---|---|
| Starburst 370-e | Lakehouse - cache | Lakehouse - no-cache | |
| Starburst 370-e | N/A | 108% | 68% |
| Lakehouse - cache | 92% | N/A | 62% |
| Lakehouse - no-cache | 148% | 160% | N/A |
Observations:
- Lakehouse platform initially returned 2 query execution failures due to parsing errors, which were relatively simple to fix (q11 and q20) and 1 error due to memory issues when disabling cache (q21: “Query was cancelled because it exceeded the memory limits set by the administrator.”).
- Compared to the Lakehouse platform (cache enabled), Starburst Enterprise took 1.08x longer to execute queries, on average (15.27s vs 14.09s).
- Lakehouse platform (cache disabled) took 1.48x longer to execute, compared to Starburst (22.58s vs. 15.27s).
- Disabling cache in the Lakehouse platform resulted in 1.6x longer execution times on average, compared to the Lakehouse platform with cache enabled (22.58s vs 14.09s)
- There were no parsing or system failures returned by Starburst Enterprise.
TPC-DS 1TB Parquet - Performance Comparison
| qid | Starburst 370-e | LH - cache | LH - no-cache |
|---|---|---|---|
| q01 | 5 | 8 | 6 |
| q02 | 8 | 18 | 20 |
| q03 | 3 | 3 | 7 |
| q04 | 17 | 35 | 42 |
| q05 | 7 | N/A | N/A |
| q06 | 2 | 5 | 7 |
| q07 | 6 | 6 | 10 |
| q08 | 4 | 3 | 5 |
| q09 | 30 | 12 | 70 |
| q10 | 4 | 19 | 20 |
| q11 | 10 | 19 | 24 |
| q12 | 1 | 2 | 7 |
| q13 | 5 | 5 | 6 |
| q14 | 33 | 54 | 68 |
| q15 | 1 | 2 | 4 |
| q16 | 8 | 23 | 28 |
| q17 | 5 | 11 | 15 |
| q18 | 4 | 7 | 13 |
| q19 | 4 | 5 | 5 |
| q20 | 1 | 3 | 5 |
| q21 | 8 | 13 | 12 |
| q22 | 16 | 15 | 18 |
| q23 | 31 | 43 | 65 |
| q24 | 21 | N/A | N/A |
| q25 | 3 | 8 | 12 |
| q26 | 3 | 4 | 6 |
| q27 | 2 | 7 | 10 |
| q28 | 12 | 12 | 29 |
| q29 | 6 | 10 | 14 |
| q30 | 4 | 7 | 7 |
| q31 | 5 | 12 | 18 |
| q32 | 1 | 5 | 5 |
| q33 | 5 | 12 | 14 |
| q34 | 2 | 4 | 8 |
| q35 | 3 | 33 | 32 |
| q36 | 2 | 8 | 12 |
| q37 | 8 | 9 | 13 |
| q38 | 5 | 8 | 10 |
| q39 | 6 | 18 | 24 |
| q40 | 3 | N/A | N/A |
| q41 | 0 | 2 | 2 |
| q42 | 1 | 2 | 4 |
| q43 | 1 | 4 | 6 |
| q44 | 7 | 7 | 18 |
| q45 | 2 | 3 | 8 |
| q46 | 2 | 5 | 8 |
| q47 | 13 | 29 | 36 |
| q48 | 3 | 4 | 5 |
| q49 | 9 | N/A | N/A |
| q50 | 4 | 11 | 22 |
| q51 | 4 | N/A | N/A |
| q52 | 1 | 2 | 3 |
| q53 | 2 | 4 | 7 |
| q54 | 7 | 14 | 25 |
| q55 | 2 | 2 | 4 |
| q56 | 6 | 12 | 14 |
| q57 | 8 | 22 | 33 |
| q58 | 3 | 7 | 10 |
| q59 | 6 | 24 | 29 |
| q60 | 4 | 13 | 16 |
| q61 | 2 | 4 | 7 |
| q62 | 3 | 3 | 4 |
| q63 | 3 | 4 | 7 |
| q64 | 20 | 53 | N/A |
| q65 | 7 | 9 | 13 |
| q66 | 2 | 12 | 18 |
| q67 | 29 | 37 | 37 |
| q68 | 5 | 5 | 8 |
| q69 | 2 | 13 | 17 |
| q70 | 6 | 13 | 16 |
| q71 | 2 | 3 | 8 |
| q72 | 31 | N/A | N/A |
| q73 | 1 | 2 | 4 |
| q74 | 7 | 17 | 21 |
| q75 | 19 | N/A | N/A |
| q76 | 5 | 7 | 12 |
| q77 | 4 | N/A | N/A |
| q78 | 18 | N/A | N/A |
| q79 | 3 | 5 | 8 |
| q80 | 9 | N/A | N/A |
| q81 | 4 | 5 | 12 |
| q82 | 7 | 10 | 16 |
| q83 | 2 | 2 | 5 |
| q84 | 3 | 3 | 4 |
| q85 | 7 | 6 | 9 |
| q86 | 2 | 3 | 5 |
| q87 | 5 | 6 | 8 |
| q88 | 15 | 11 | 17 |
| q89 | 2 | 4 | 9 |
| q90 | 4 | 1 | 3 |
| q91 | 2 | 3 | 6 |
| q92 | 1 | 3 | 8 |
| q93 | 10 | N/A | N/A |
| q94 | 5 | 20 | 26 |
| q95 | 12 | 23 | 26 |
| q96 | 2 | 1 | 2 |
| q97 | 7 | N/A | N/A |
| q98 | 1 | 3 | 6 |
| q99 | 4 | 5 | 6 |
| Avg | 6.57 | 10.55 | 14.65 |
| Max | 33.00 | 54.25 | 69.75 |
| Min | 0.25 | 1.00 | 2.00 |
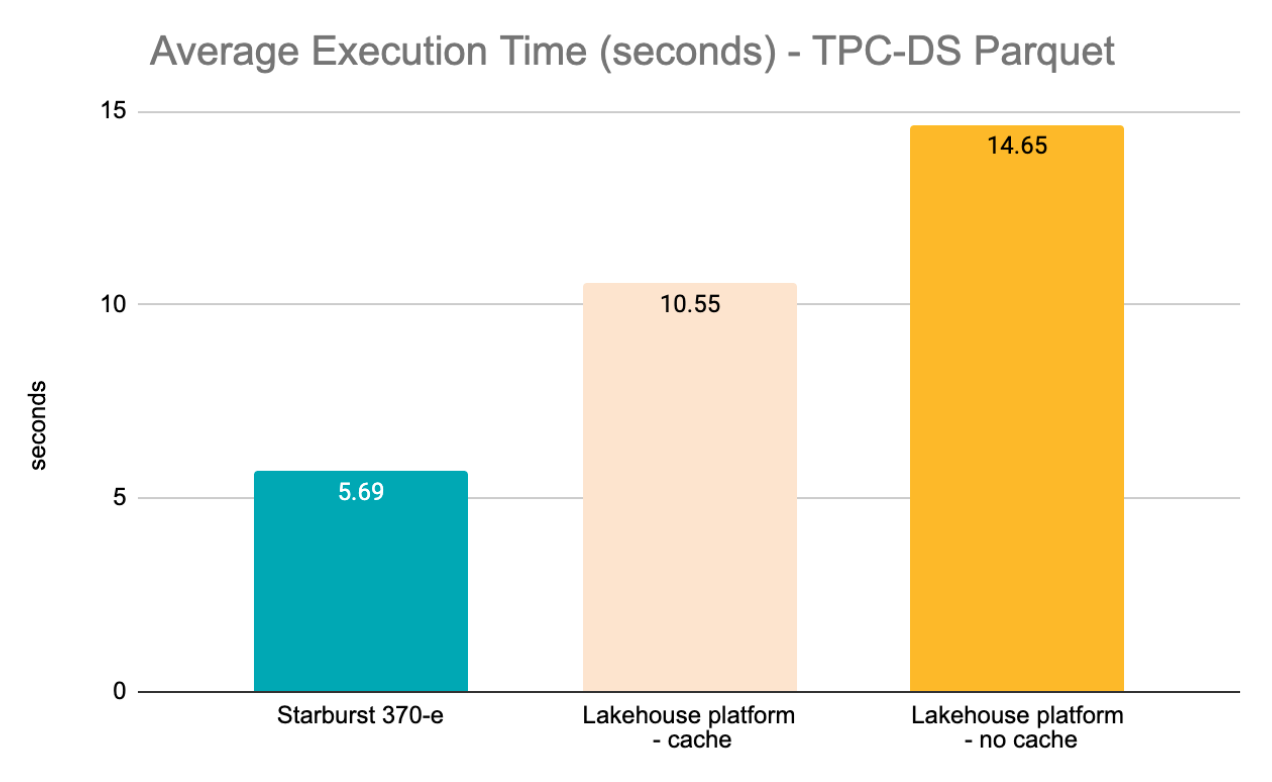 * chart shows average for the subset of 87 queries that could be executed in both engines
The table below shows the average query execution time relative to each platform, as a percentage:
| relative to: | |||
|---|---|---|---|
| Starburst 370-e | Lakehouse - cache | Lakehouse - no-cache | |
| Starburst 370-e | N/A | 54% | 39% |
| Lakehouse - cache | 185% | N/A | 72% |
| Lakehouse - no-cache | 257% | 139% | N/A |
Observations:
- Lakehouse platform initially returned parsing errors for 39 queries, out of which 28 could be fixed in a relatively simple way (Lakehouse platform doesn’t support the DECIMAL function followed by a string: “DECIMAL ‘1.23’”, for example). For the remaining 11, I couldn’t find a suitable fix and the error message pointed to a JOIN statement in the queries.
- I consistently had to cancel q24 in the Lakehouse platform after 10 minutes of execution. q64 in Lakehouse platform consistently failed due to memory issues when cache was disabled.
- For the Lakehouse platform (cache enabled) scenario, there were a few errors due to nodes ceasing to respond: q11 (run 2), q23 (run3). The returned error was “The target server failed to respond”. These queries didn’t fail consistently, since they finished successfully in 3 out of 4 executions.
- For the Lakehouse platform (no cache) scenario, there were a few system errors. q11 (run 3), q13 (run 4), q32 (run 3), q39 (run 3), q47 (run 4), q65 (run 3): “One or more nodes lost connectivity during query” or “The target server failed to respond”. Similar to the Lakehouse platform (cache enabled) scenario, these queries didn’t fail consistently in all 4 executions.
- In the Lakehouse platform, disabling caching resulted in an execution average 1.39x higher compared to having cache enabled (14.65s vs. 10.55s) .
- Considering the average execution time for the 87 queries that could be executed in all platforms - Starburst Enterprise (5.69s), Lakehouse platform cache-enabled (10.55s) and Lakehouse platform no-cache (14.65s) - Lakehouse platform (cache enabled) took 1.85x longer to execute compared to Starburst and Lakehouse platform (no cache) took 2.57x longer to execute compared to Starburst.
- There were no parsing or system failures returned by Starburst Enterprise.
Cost Optimization Recommendations
Data Analytics deployments can easily cost several thousands of dollars each month, if not planned and managed properly. Therefore it’s important to follow a number of steps as early as possible in the design and implementation stages. Below are some recommendations:
- Avoid high Data Transfer costs. AWS charges for data transferred between AWS regions and for data transferred between EC2 instances in the same region but across different Availability Zones. Since Big Data workloads, by definition, involve high amounts of data to be analyzed, these costs can easily turn into a high AWS bill.
- Intra-regional. Data Transfer across EC2 instances in different Availability Zones in the same region costs $10/TB in each direction. Given that clusters involve a high number of EC2 instances, there are usually high amounts of data exchanged among EC2 instances in a cluster. If instances are deployed in multiple Availability Zones, this will result in high intra-regional data transfer fees. For most applications that require high availability, deploying in multiple AZs is a best practice. However, most Data Analytics deployments run asynchronous jobs and have a higher tolerance for potential AZ failures, therefore in most cases it’s acceptable to deploy EC2 instances in a single AZ. I’ve seen situations where not following a single AZ deployment approach in Big Data clusters results in thousands of dollars in a single month.
- Inter-regional. Thinking about performance, it’s always recommended to deploy EC2 instances in the same AWS region as data sources (i.e. S3 buckets, RDS DBs, etc.) in order to reduce data transfer latencies. But cost is also a big factor. Depending on the origin and destination regions, inter-regional data transfer fees between S3 and EC2 instances range between $10 and $150 per TB. Most regions in the US result in $20 per TB for inter-regional data transfer. Transferring data from S3 buckets located in Sao Paulo or Cape Town, to EC2 instances in other regions, can cost close to $140/TB or $150/TB respectively.
- Both Starburst and the Lakehouse platform provide a CloudFormation template in the AWS Marketplace, which enables and simplifies automation when it comes to launching and terminating clusters. Starburst capacity can be updated through CloudFormation or EC2 AutoScaling APIs. Both solutions offer the toolset required to automate the launch, adjustment and termination of compute capacity and manage cost efficiently.
- EC2 Auto Scaling can be used in a Starburst cluster, configuring metric-based or scheduled-based rules to adjust capacity based on compute utilization as well as specific time periods (i.e. evenings, weekends, etc.). In addition to any rules configured in the provided CloudFormation template, developers can create custom Auto Scaling rules based on specific deployment requirements.
- AWS Savings Plans and EC2 Reserved Instances should be considered as an option to reduce compute cost, once instance types and capacity are well established for a particular cluster. It’s important to calculate the right commitment of RIs or Savings Plans. For more details on Reserved Instances, you can refer to this article I wrote. I also wrote this article that covers Savings Plans in detail. Keep in mind that Reserved Instances or Savings Plans would only cover compute costs, not license fees.
- Calculate cost as early as possible, based on the factors mentioned above (i.e. EC2 instance types required, number of nodes, auto-scaling and launch/termination schedules, data transfer needs, etc.). It’s recommended to execute a few tests and monitor the relevant metrics as well as AWS Cost and Usage Reports, to ensure there are no unforeseen items that could potentially result in a high AWS bill. Application and infrastructure optimizations are an iterative process, which has a significant impact on cost savings in the long term.
Conclusions
- For the TPC-H Parquet tests, on average the Lakehouse platform with cache disabled took 1.48x longer to execute, compared to Starburst (22.58s vs. 15.27s) and Starburst took 1.08x longer to execute compared to the Lakehouse platform with cache enabled.
- Disabling cache in the Lakehouse platform resulted in 1.6x longer execution times on average compared to having cache enabled, for the TPC-H tests.
- When it comes to TPC-DS, disabling caching in the Lakehouse platform resulted in an execution average 1.39x higher compared to having cache enabled.
- Considering the average execution time for the 88 TPC-DS queries that could be executed in all platforms, the Lakehouse platform (with cache enabled) took 1.85x longer to execute compared to Starburst and the Lakehouse platform (with cache disabled) took 2.57x longer to execute compared to Starburst.
- There were no parsing or system failures returned by Starburst Enterprise in either TPC-H or TPC-DS tests.
Do you need help optimizing your Big Data workloads in the cloud?
I can help you optimize your Big Data workloads in the cloud and make sure they deliver the right balance between performance and cost for your business. Click on the button below to schedule a free consultation or use the contact form.