
*Price calculations using AWS Price List API
“How should I configure my EC2 infrastructure? What components should I use? What instance types should I choose? t3.large? m5.large?”
That’s one of the most common questions I hear from EC2 users. And it’s one question for which I have the most annoying answer of all: “It depends."
It’s an annoying answer because it doesn’t offer an immediate solution. Finding the right AWS infrastructure is not an easy task; there are a lot of variables that come from your application requirements and there are a lot of knobs in AWS. Put all variables together and we have an overwhelming number of options. Without proper testing, we can only guess.
The only way to make an informed decision is to execute performance tests, monitor metrics, identify patterns, fine-tune, rinse and repeat.
So that’s what I decided to do for this post. I will show you a sample application and some real steps and tests I followed for finding optimal EC2 infrastructure.
Let’s get started…
Step 1 - What business function is this all about?
Systems are useless unless they fulfill a business function. The first thing we need to be clear about is how to articulate a business function in terms that can be quantified and translated into system requirements. In this example I will use a hypothetical WordPress site that is critical to our customer. Our customer knows today’s number of visitors to her site and is worried her current infrastructure won’t keep up with future growth. Our customer will be happy only when she has certainty her site will handle the expected volume one year from now. And when her site grows further, she wants to have certainty that adapting her AWS infrastructure for even more visitors becomes a trivial task moving forward.
The requirements
- In its steady state, the site must handle 1,000 concurrent visitors at any given time. Visitors spend on average 30 seconds on each page before they click on a different link or leave the site.
- The site is running on WordPress and the customer doesn’t want to change that.
- Visitors have short attention spans and don’t have tolerance for slow load times. Transactions must be processed in less than 500 milliseconds.
- It’s not unusual for this site to publish popular items and temporarily double its traffic. Last summer they had a popular campaign that doubled their visitors within 1 hour.
- When traffic is low, the customer doesn’t want to pay for unused resources.
What type of EC2 infrastructure should I set up for my system to handle these requirements?
Step 2 - What are my system requirements?
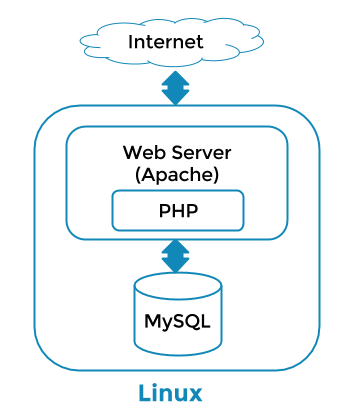
WordPress is a Content Management System that powers millions of websites and blogs around the world. In its simplest form it consists of an Apache web server running on Linux that connects to a MySQL database, like this:
My system should do the following:
- I want elastic infrastructure that scales out automatically based on resource consumption. I need this system to double its capacity so it can handle 2,000 visitors within one hour. The more resources users consume, the more infrastructure I’ll have to provision. On the other hand, if resources are not being consumed, I don’t want to pay for unused infrastructure. This is a typical use case for Auto Scaling.
- I want resource utilization to be at no more than 50% of its full capacity, so my components can handle spikes in traffic or situations where capacity is temporarily reduced (i.e. an unhealthy server being replaced or a server being temporarily unavailable during deployments).
- Servers are distributed in at least 2 AWS Availability Zones. Therefore, if one Availability Zone is experiencing problems, I want the application to not suffer from it.
The system under test
Regarding my specific WordPress setup:
- As mentioned earlier, WordPress requires a MySQL database. I could set up one myself, but it’s much easier if I use AWS RDS (AWS Relational Database Service) to launch and manage a highly scalable and resilient MySQL server.
- To make my hypothetical site more realistic, I created 500 posts in my WordPress database, using the Demo Data Creator plugin.
- My WordPress configuration uses Apache web servers to serve internet traffic. These web servers point to the RDS MySQL instance that I set up.
- I want to use Auto Scaling, therefore I need to have stateless web servers. This means no server should keep any data related to previous transactions. This way I can add fresh servers at any time and they can seamlessly process incoming transactions and focus exclusively on computation tasks. If one server goes down, a new one can easily handle incoming transactions.
- Since I need all my web servers to be stateless, I used the W3 Total Cache plugin. This means that no static files are stored in my web servers. If I write a new post or upload media files, this data is stored in S3 and the MySQL database. When new servers are launched, they will fetch data and files from RDS and S3, therefore they will do only computation tasks and will be able to handle incoming traffic seamlessly.
Architecture
- I want different application functions to use separate infrastructure. In this case, web servers and database servers must live in different infrastructure components. This way I can scale these architecture components independently, for example increase capacity in my web servers or my database servers only.
- I want multiple, load balanced servers. All servers get a similar volume of traffic. If one server goes down or is unhealthy, I must have a way to stop sending traffic to it and replace it immediately. The application must not suffer degradation as a result of failure in a single web server. I will use an Elastic Load Balancer for this purpose and link it to an Auto Scaling group.
Additional test and monitoring components:
- I need to generate load on the system and measure response times. I will use Locust as a load testing tool. I wrote my tests so that each virtual user has a random think time between 15 and 30 seconds. This simulates the time it would take a real user to read a post before clicking on a different post or leaving the site.
- I will use Concurrency Labs Locust-CloudWatch Connector to export test result metrics to CloudWatch, so I can visualize and analyze them together with system metrics in a CloudWatch Dashboard.
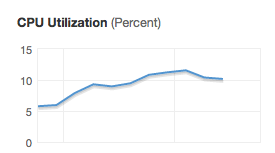
- I will use Concurrency Labs near-realtime EC2 price calculator. This tool will allow me to visualize a monthly EC2 cost estimation in near-realtime, published as a CloudWatch metric, while I execute load tests.
- I used New Relic for metrics that are not available in AWS CloudWatch. I am particularly interested in memory consumption, which is not available in CloudWatch. New Relic also gives me CPU and memory consumption metrics broken down by individual processes in my servers, which is a handy feature.
- And of course, CloudWatch metrics. For my tests I use CloudWatch Dashboards, which are a great way to visualize multiple metrics in a single page. Without CloudWatch dashboards you would have to switch pages for each relevant CloudWatch metric during your tests (ELB, Auto Scaling, EC2, RDS) and I don’t think anyone would enjoy doing that.
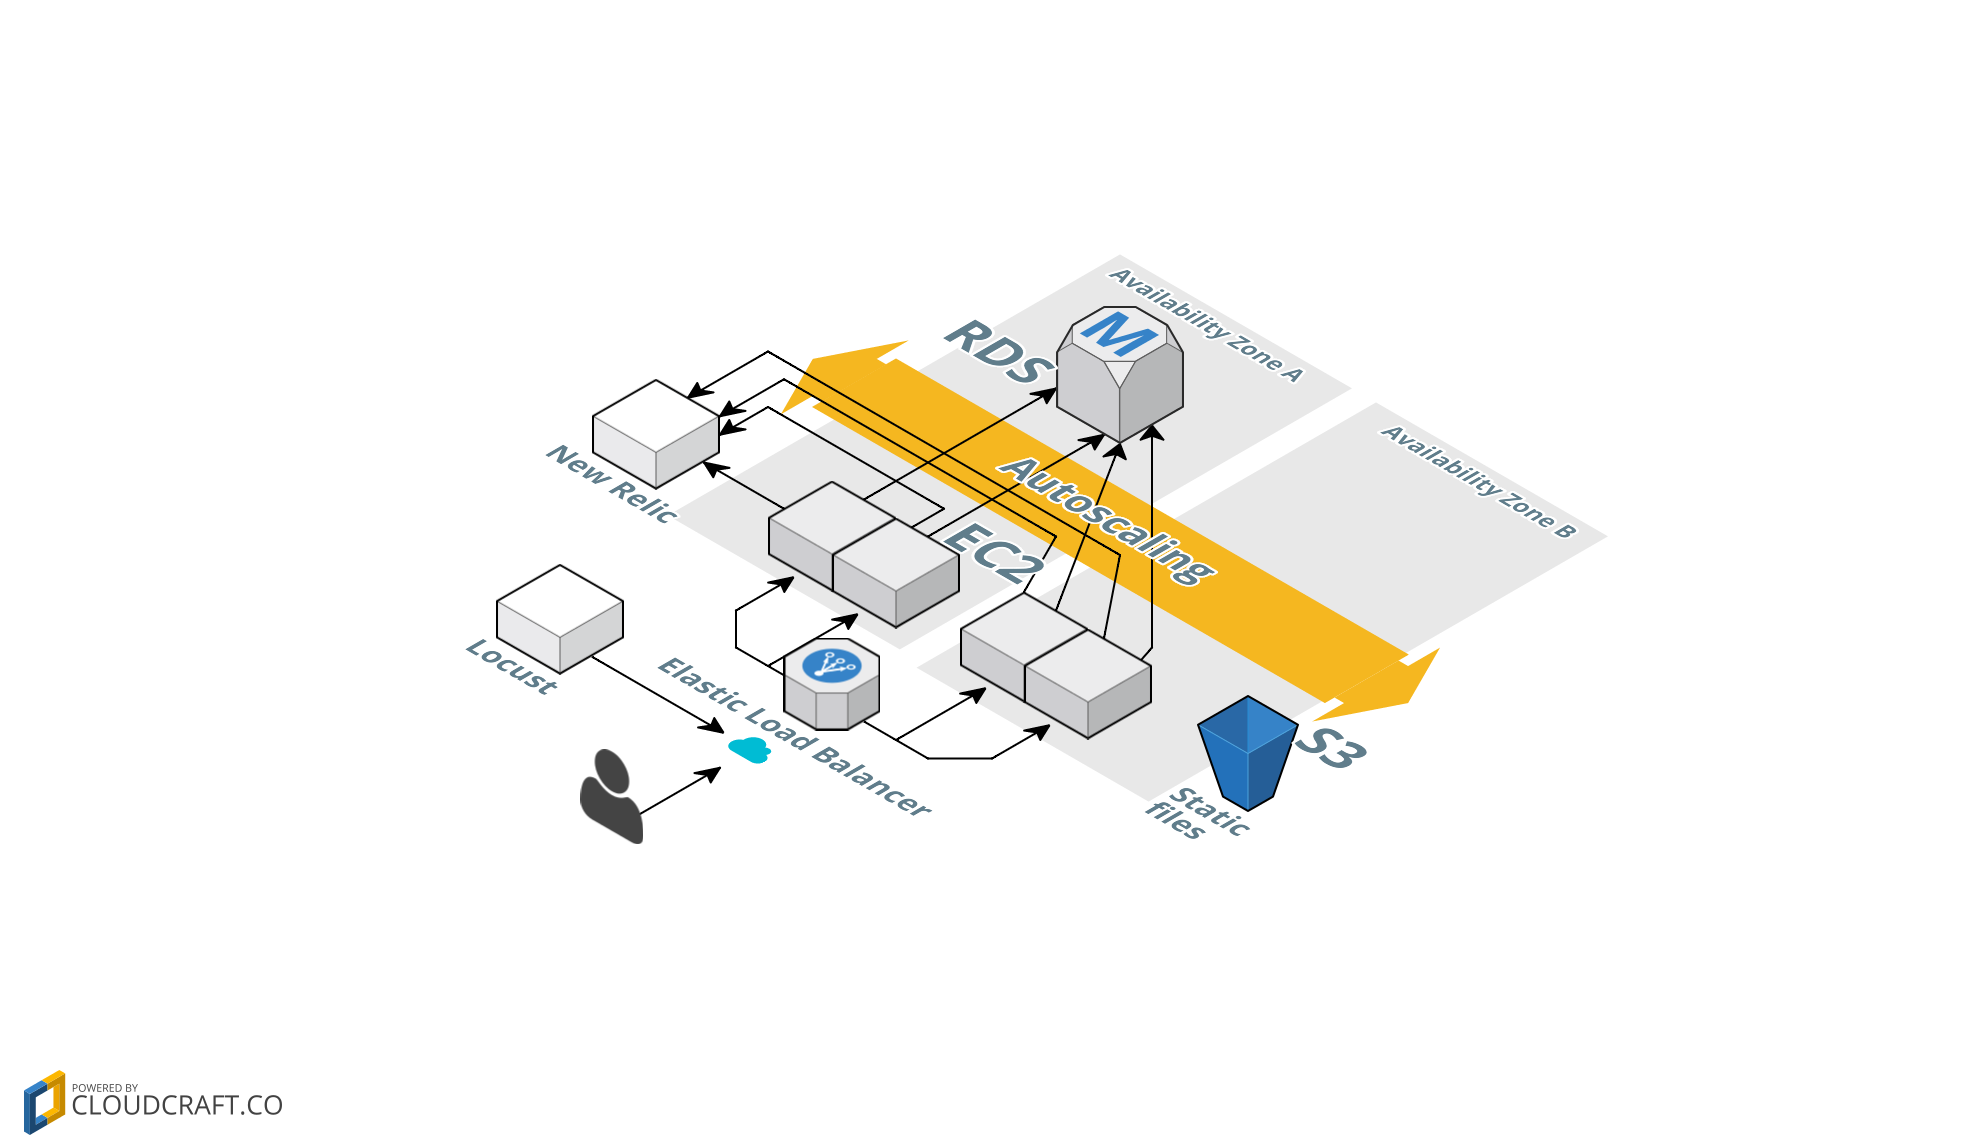
The AWS architecture I configured looks like this:
Steps 3, 4, 5… test, measure, repeat
Test 1 - t3.large - 100 concurrent users
I started with a quick, small load test just to have an idea of how the system behaves. For a high traffic, scalable and resilient application like the one we want, I typically start with larger instance types. My first option for this test was to configure my Auto Scaling group with a Launch Configuration based on a t3.large instance type. Here are the basic specs for the t3.large instance type:
| Type | vCPU | Mem(GiB) | Baseline CPU % | Cost (US East) |
|---|---|---|---|---|
| t3.large | 2 | 8GB | 30% |
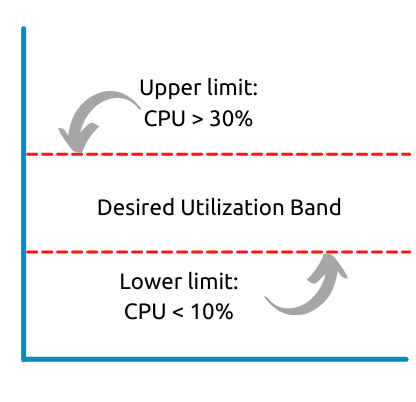
When working with t3 instance types, it is critical to understand CPU Credits. The t3.large gives us a nice baseline CPU utilization of 30%, which means my CPU credits will not decrease as long as I keep my utilization below 30%. I configured my Auto Scaling group such that instances are launched when average CPU utilization is greater than 30% and terminated if the average CPU Utilization is less than 10%. I see this as a safe range that allows my instances to react to spikes in traffic and prevents me from paying unnecessarily due to underutilization.
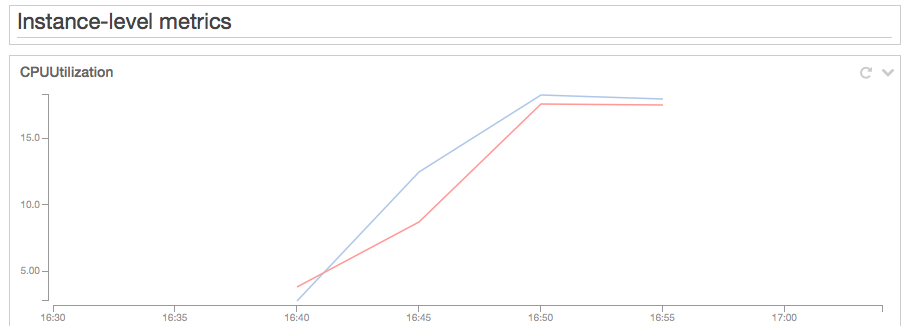
Test results: 100 concurrent users with a random think time between 15 and 30 seconds results in 4 transactions per second. My AutoScaling group stabilized at 2 instances, which peaked at 17% CPU utilization. Having two t3.large instances seems appropriate for 100 concurrent users.
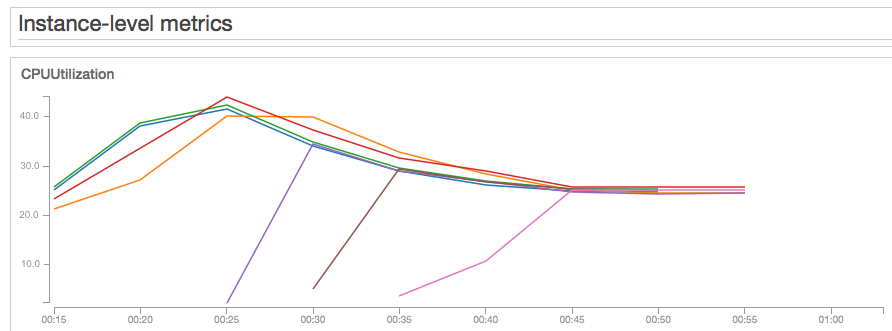
Test 2 - t3.large - 1,000 concurrent users
Right after I completed my test with 100 users, I ramped up the number of users to 500, waited a few minutes and then continued to 1,000 users. It is important to gradually increase the load, otherwise we could get false negatives due to suddenly increasing the load on the system by a factor of 10. I kept the Auto Scaling policy to the same parameters as my previous test: increase when CPU utilization is >= 30% and decrease when it is <10%.
Test results: 1,000 concurrent users resulted in 45 transactions per second. The Auto Scaling group stabilized with seven t3.large instances at a 25% average CPU Utilization. This is a sustainable CPU Utilization that will accrue CPU credits that I could use in case there is a spike in traffic. Response times: median=229ms, P90=322ms, P99=764ms, max=1131ms. Keep in mind that my Locust load generator lives in the same region as my web servers, therefore the response times are lower than what real users would experience when they access from different locations worldwide. As long as we compare response times from the same load generator when testing different instance types, we’ll be comparing apples to apples.
Calculating data transfer (which is a bit tricky)
- At its peak, there was an aggregated 2.4GB of data transfer out per hour for all instances. This translates into roughly 1.7TB of EC2 data transferred out of the EC2 instances per month.
- Since this data is transferred to the ELB, it is considered an EC2 internal transfer, which is cheaper than data transferred out to the internet.
- We have 7 instances distributed in 2 Availability Zones (3 in us-east-1a and 4 in us-east-1b) and the ELB is in us-east-1a. Therefore we have 3 instances doing data transfer within the same AZ (which costs $0) and 4 instances doing data transfer to another AZ within the same region (which costs $0.01 per GB).
- This results in approximately 971GB of data transferred across AZ from EC2 instances to the ELB, each month.
- The ELB processed approximately 2.7GB of data per hour, which would result in 1.94TB of data processed per month.
Estimated monthly cost in the US East region:

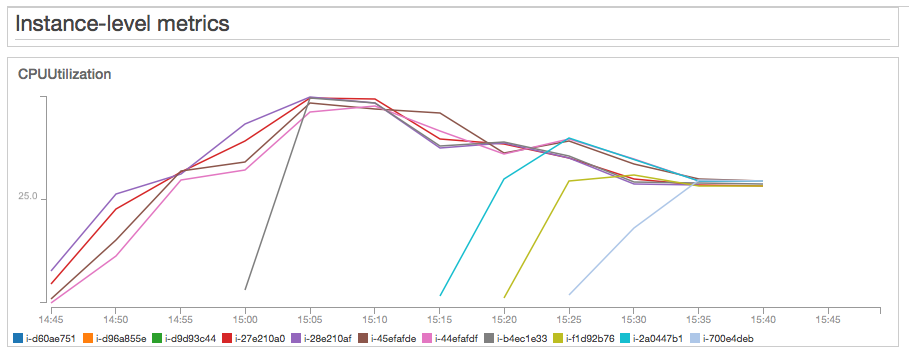
Test 3 - m5.large - 1,000 concurrent users
The next alternative for my experiment was an m5.large EC2 instance. M5.large instances feature a 2.6GHz processor optimized for EC2. The specs are very similar to those of the t3.large, but they don’t have a baseline CPU% utilization, which means we don’t have to worry about CPU credits. They have 6.5 ECUs (EC2 Compute Units), which are the standard units of compute power as measured by AWS. However, I can’t really compare ECUs against a t3.large, since ECUs are variable in t3 instance types. The m5.large instance is slightly more expensive than the t3.large:
| Type | vCPU | ECU | Mem(GiB) | Baseline CPU % | Cost (US East) |
|---|---|---|---|---|---|
| m5.large | 2 | 6.5 | 8GB | N/A |
Test results: At 1,000 concurrent users, the Auto Scaling group stabilized with eight m5.large instances at an average CPU utilization of 28%. Not only will we pay more due to having 8 instances, but also the average resource utilization is a bit higher (28% vs. 25% for the t3.large test). Response times: median=277ms, P90=873ms, P99=5168ms, max=7067ms
… and then I noticed something interesting, thanks to New Relic’s Physical Memory metrics:
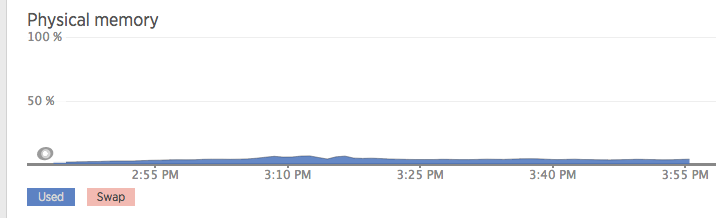
What is it with this low memory consumption? This graph is basically telling me I don’t have to pay a premium for the higher memory specs that come with the t3.large and m5.large instances! I also looked at the disk read and write operations metrics and they are close to zero. Since my servers are stateless, they barely perform any read or write operations, so I don’t have to pay a premium for EBS optimization either.
So far my test results and metrics have been telling me that my application is CPU intensive.
Wouldn’t it be nice to get a similar CPU performance and avoid paying extra for resources that I don’t need, such as memory and high EBS throughput?
That’s why I decided to execute a test with t3.medium instances…
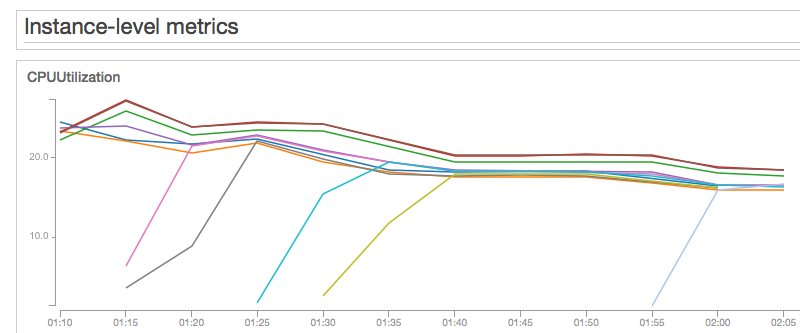
Test 4 - t3.medium - 1,000 concurrent users
For this test, I used an Auto Scaling launch configuration with t3.medium instances. T3.medium instances have the same computing power as t3.large ones, but half the memory (and exactly half the cost). They have, however, a lower baseline CPU utilization of 20%. This means I have to maintain the CPU Utilization below 20% to avoid CPU Credit depletion. Even with this caveat, I still wanted to take a closer look. I configured the Auto Scaling policy to launch 1 new instance when the average CPU utilization is >= 20% and to terminate 1 instance when utilization is less than 10%. Similar to my previous tests, I gradually increased the number of users until I reached 1,000 concurrent users with a random think time between 15 and 30 seconds.
| Type | vCPU | ECU | Mem(GiB) | Baseline CPU % | Cost (US East) |
|---|---|---|---|---|---|
| t3.medium | 2 | variable | 4GB | 20% |
Test results: At 1,000 concurrent users, the Auto Scaling group stabilized at 11 t3.medium instances and a 18% average CPU Utilization. Memory consumption was below 10% in all servers. Response times: median=232ms, P90=296ms, P99=564ms, max=852ms
So far, t3.mediums are winning. They are giving me better response times and lower cost.
And just in case you were wondering, I generated 1,000 concurrent users with a single t2.nano instance running Locust, which peaked at around 10% CPU Utilization. I really like t2.nanos for testing purposes.
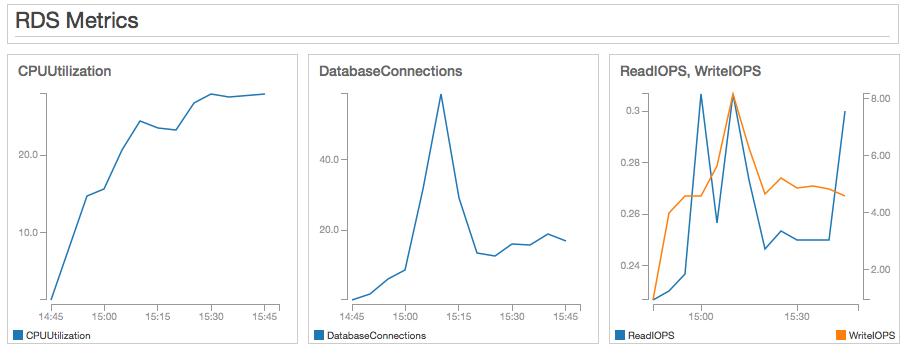
Last, but not least, some relevant RDS metrics at 1,000 concurrent users. They confirm to me that the main bottleneck in this test was CPU utilization in the WordPress web servers.
Test 5 - t3.medium - traffic spike to 2,000 concurrent users
Now that I have settled for t3.medium instances, I still want to make sure they can handle a 100% spike in traffic. I increased the number of concurrent users to 2000 over a 15 minute period, resulting in 90 transactions per second. This is intentionally steeper than the original requirement of 100% increase over 1 hour.
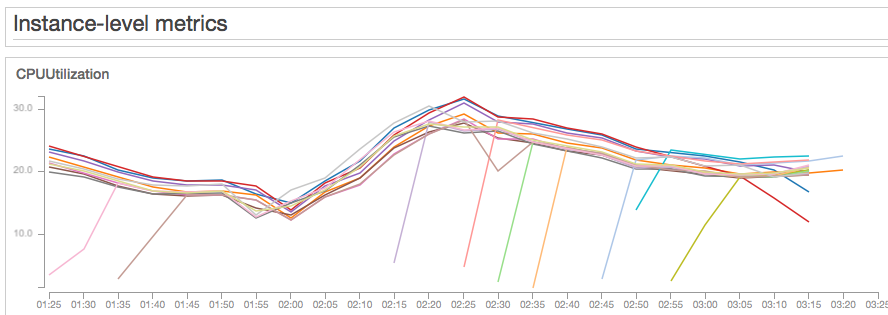
The overall CPU usage increased to around 30% and it stabilized with 18 instances at an average utilization of 19% for the whole Auto Scaling group. I am confident the system will handle a 100% spike in traffic over 15 minutes and still have wiggle room for an even steeper spike. Response times: median=350ms, P90=835ms, P99=1836ms, max=2711ms. Response times are higher during the spike, mainly due to the fast ramp up. Once additional instances were launched and CPU utilization stabilized at 19%, response times returned to the values seen in the 1,000 concurrent user test. One thing to note is that your account EC2 instance limits should be set to more than 20 instances per region, otherwise you could end up being unable to launch new instances when you most need them.
To summarize:
- It is easier to achieve optimization if you use a methodical approach. I use a series of
steps, with the following sequence:
- Quantify business flows.
- Translate those business flows into system requirements and start with a hypothesis on which EC2 configuration will be appropriate.
- Test.
- Review metrics and validate or reject assumptions - keep track of performance, price and availability metrics.
- Update configuration based on available test results and metrics - iterate and reach a conclusion.
- For this particular requirement and application, the t3.medium is the clear winner for me. It not only beats the infrastructure I set up with t3.large and m5.large instances on price, but also on response times. The median response times are similar at around 230 ms, but the maximum response time for a t3.medium configuration is 852ms, compared to 1131ms for a t3.large and 7 seconds for an m5.large.
- Since we have 11 t3.medium instances, our infrastructure will be more resilient to failure if a single instance is unhealthy, compared to 7 t3.large or 8 m5.large instances required for 1,000 concurrent users. The more instances I have, the less I will feel it when one of them goes bad.
- CloudWatch metrics alone are not enough for monitoring performance test results. For example, memory consumption is not available in CloudWatch. I use New Relic, which has a useful free tier. In this experiment, having New Relic helped me view that memory utilization was very low and made me consider using t3.medium instances instead.
- CloudWatch dashboards are essential if you’re doing performance tests. They allow you to have all relevant metrics in a single page. Without them, it would be very time consuming to check all relevant metrics during a test.
- These results don’t mean t3.medium instances would be a clear winner with a different set of requirements. Maybe my results will be different if I test for 10,000 or 100,000 concurrent users. Always test. There is no way to know how a specific configuration will respond for a particular application and set of requirements unless you test. There is no way around that.
Additional Comments:
- I could optimize this configuration further by adding a CloudFront distribution. However, this was beyond the scope of this article. I wanted to focus exclusively on EC2 infrastructure performance and optimization.
- As I mentioned at the beginning, I reduced my set of requirements intentionally for simplicity.
Are you looking for ways to save money while running fast applications on EC2, or other AWS services?
I can certainly help you with planning and managing your AWS cost. In many cases, I can save my clients at least 25%. Just click on the Schedule Consultation button below and let’s have a chat.