
If you are building a software application, it is essential that you test it for performance. This way you experience the limits of your cloud deployment in a TEST environment and not when real customers suffer performance degradation. Your performance tests should answer questions such as: how many users can my app handle? where are my app’s bottlenecks? where is my app’s breaking point? how much will it cost me to handle X amount of users?
Just because AWS powers some of the biggest applications in the world, this doesn’t mean your particular cloud deployment is ready to handle millions of users. You still need to performance-test your software and fine-tune your AWS components. There are many tools that you can use to simulate load on your system; a very popular one is JMeter, a free open source application that simulates user load and records performance results.
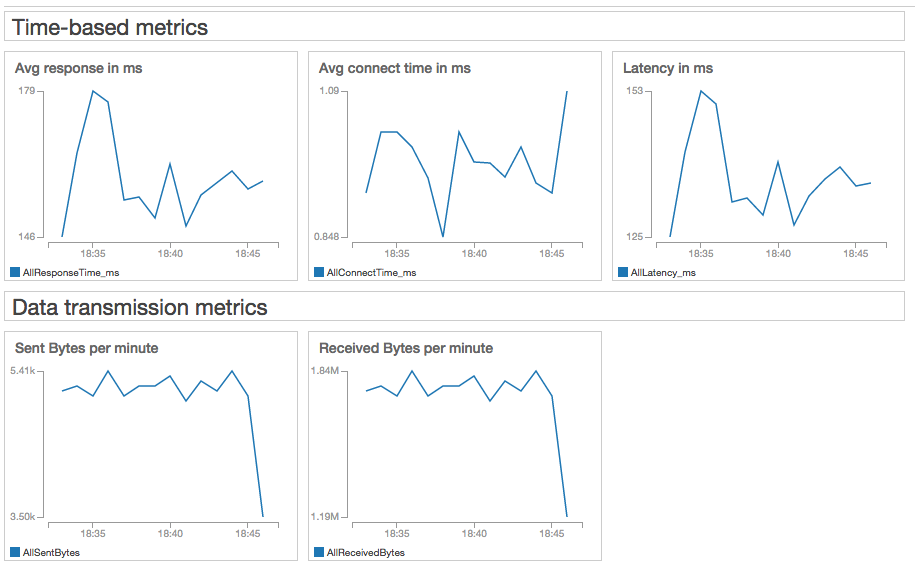
In this post we’ll take a look at a method that will enable you to automatically export and visualize your JMeter test results in real-time as CloudWatch metrics. At the end of this exercise you’ll see something like this:
You will also have a CloudFormation template that automates the setup of JMeter and CloudWatch metric filters; this will save you a lot of clicks and CLI commands. I am also including a sample JMeter test plan to get you started. In the future, the only thing you’ll need to do is upload your own JMeter test plan to an EC2 instance, execute it and see your metrics flow into CloudWatch in real-time. Cool, isn’t it?
… but wait, JMeter already has a GUI where I can see my test results. Why would I want to export my test results to CloudWatch?
First, let’s talk about CloudWatch. CloudWatch is AWS’ metrics aggregation service. All AWS services publish metrics to CloudWatch, which allow us to monitor the health and performance of our AWS cloud components. We can also publish custom metrics to CloudWatch, which enables us to monitor application-specific events. CloudWatch Logs allows you to export log records from your servers into CloudWatch and create metrics based on patterns present in your log files, such as timestamps or keywords. We will use CloudWatch Logs to export JMeter test results from your server into CloudWatch metrics that we can monitor and visualize in the AWS console.
Here are some good reasons to publish JMeter test results to CloudWatch:
- Even though you could view your test results using JMeter’s Response Time Graph or similar listeners, you will eventually need to correlate your JMeter test results with other performance metrics that are only available in CloudWatch. You want to know what effect your load test is having on key AWS metrics, such as CPU utilization, CPU Credits, Disk Read/Writes, BytesIn/Out, System Health Checks, etc. Most importantly, you want to see how these AWS metrics will affect your customer experience. Correlating test result metrics with AWS metrics will be easier if you have them in a single place, such as CloudWatch.
- Chances are you will have to run your JMeter tests in server mode (and not from your laptop). Since there is no JMeter GUI available in server mode (unless you do remote desktop), you will have to export your test results somewhere anyways. In this example, we will export JMeter test results in real time using the CloudWatch Logs agent.
- If your performance test metrics are stored in CloudWatch, you can set up alarms in case your test does not run as expected. This is particularly useful when you are running long tests (hours or days long) and you really don’t want to be glued to your computer monitoring how the test is doing.
- If your JMeter results are aggregated in CloudWatch, you can automate virtually any step in your test. This opens up a lot of cool test automation use cases (i.e. stop/trigger a deployment, stop/trigger tests, add/remove capacity, notify someone, etc). The list is really up to your imagination and business needs.
- Once log data is in CloudWatch Logs, you can stream it to other AWS services, such as Kinesis, Lambda or Elastic Search for further processing. This opens up the possibility of very detailed analysis of your AWS infrastructure metrics and seeing what effect they have on your customer experience. All of this before you deploy a single line of code into a Production environment.
- You can automatically move your test results from CloudWatch Logs to S3 for archiving or later processing.
- Since your test results data will be fed into CloudWatch in real-time, you can terminate your JMeter servers when you’re done testing and save money on computing costs. Since you’ll have a Cloud Formation template, it will be trivial to launch a new JMeter server and set up the required CloudWatch metric filters when you’re ready to test again.
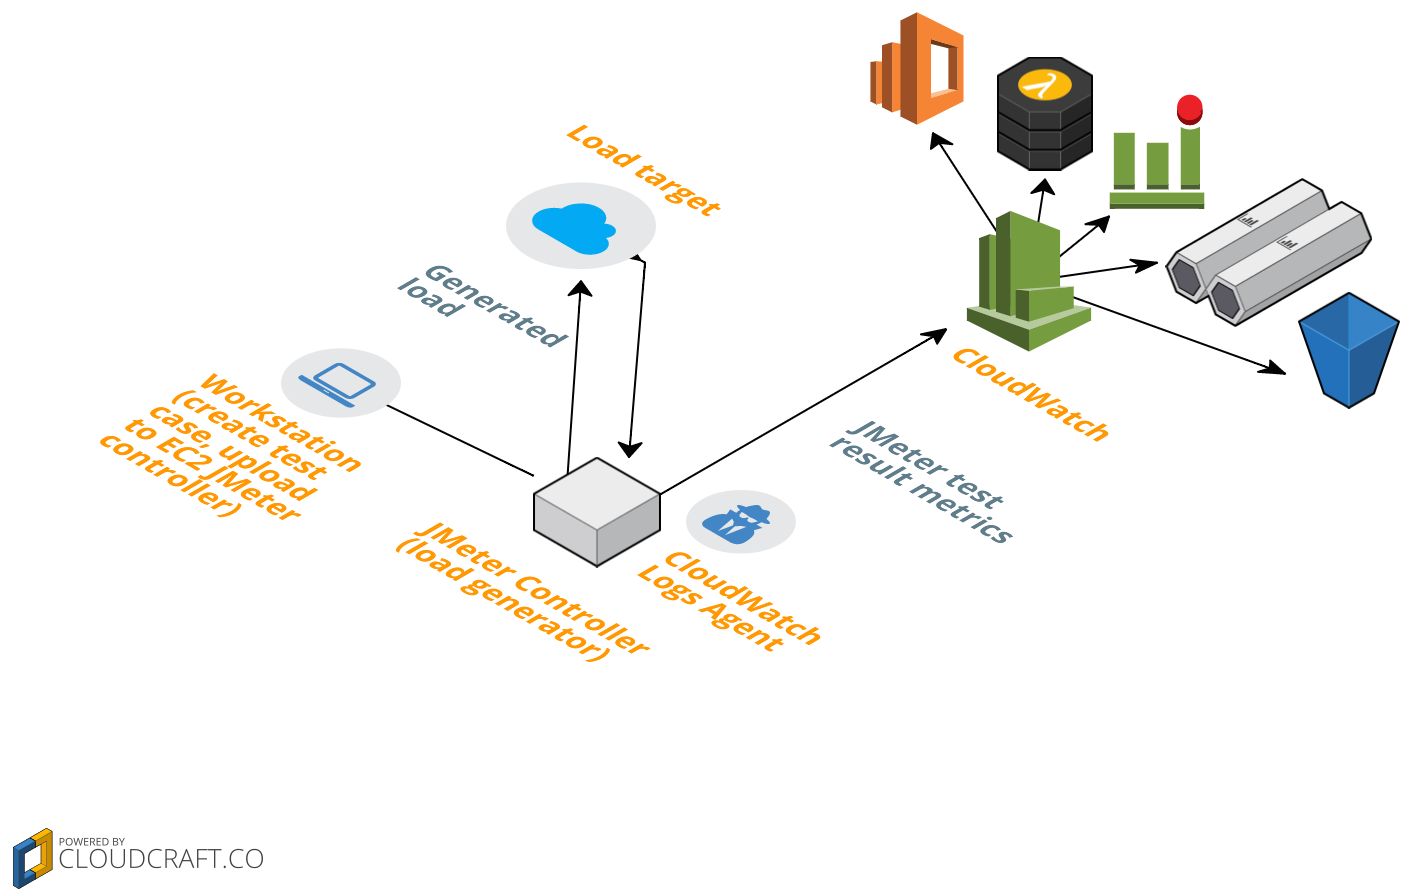
Architecture
This is what the deployment will look like: you will have an EC2 instance with JMeter installed in it as well as the CloudWatch Logs agent; this instance generates load to some target (a web server) and the CloudWatch Logs agent will publish your test results log entries to CloudWatch. CloudWatch will parse incoming log entries and convert them to CloudWatch metrics. Log entries can also be forwarded to S3, Elastic Search, Lambda or Kinesis for further processing (CloudWatch Logs subscriptions are not included in the CloudFormation template). The diagram below shows a laptop because I recommend creating and validating JMeter test cases in your workstation (using the JMeter GUI) before uploading them to the EC2 JMeter instance.
CloudFormation template
I will assume the following knowledge for this section: you are familiar with EC2 key pairs, you know how to SSH to your instance and you can execute basic commands in a Linux terminal.
You have to make sure you have at least 1 EC2 key pair in your account. If not, you can follow the steps in the EC2 documentation to create one.
I have created a CloudFormation template that takes care of: creating an IAM role for inserting data into CloudWatch Logs, launching an EC2 instance with JMeter 2.13 installed in it, installing the CloudWatch Logs agent in the EC2 instance, creating a CloudWatch log group and metric filters for the JMeter test results (transaction count, latency, response code count, connection times, sent/received bytes). This template also downloads a basic JMeter test plan to the EC2 instance.
The first thing you need to do is launch the CloudFormation stack. This will create one t2.nano instance at a charge of $0.0065 per hour and 9 CloudWatch custom metrics. The CloudWatch free-tier includes 10 custom metrics, after that you’re looking at $0.50 per metric per month. CloudWatch Logs charges $0.50 per GB ingested and $0.03 per GB archived per month. If you run the example in this post you should not incur in significant CloudWatch Logs charges (you will be far from ingesting 1GB of data). Don’t forget to delete the CloudFormation stack when you’re done, so you only pay for what you use. You can find more information on CloudWatch pricing here.
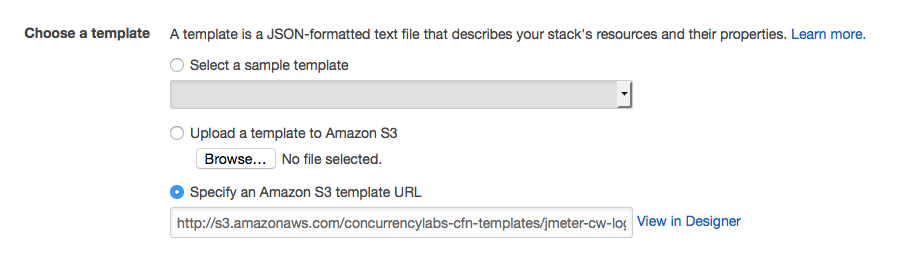
Are you ready? You can launch your stack by clicking on the button below:

The link in the button will take you to the CloudFormation console and will pre-select the S3 location of the template:
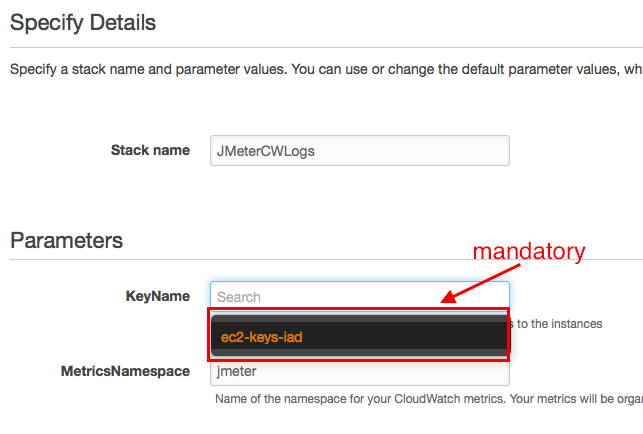
In the next screen you will select the existing EC2 key pair, which is a mandatory value. The name of your stack and namespace for your CloudWatch metrics come pre-populated, but you can change them if you like:
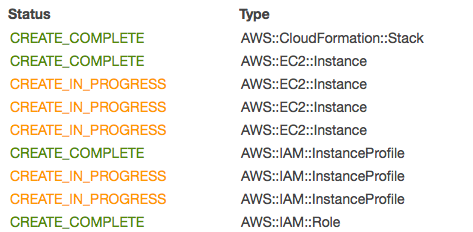
Your stack will show IN_PROGRESS for a couple of minutes and you will be able to see a list of stack creation events, until the stack creation is completed:
If you are interested in the manual steps required to configure JMeter and CloudWatch logs, I describe the steps in this page.
Now we are ready to create and run an JMeter test plan…
A JMeter test plan is an XML file that describes the behavior of your test. Since we don’t want to deal with XML directly, the best approach is to create your test plan in your computer using the JMeter GUI. This means will have to install JMeter in both your workstation AND the server you will run your Meter tests from. Trust me, it’s worth it!
I have created a GitHub repository that includes a sample JMeter test plan (which CloudFormation downloads automatically to the EC2 instance):
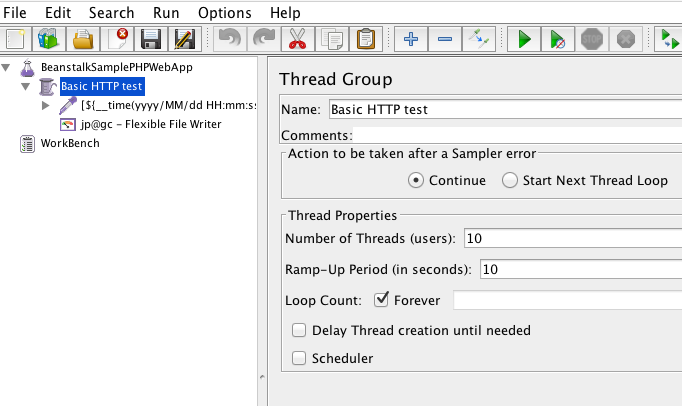
When you create a test plan in JMeter, the first thing you specify is the Thread Group (or number of concurrent users). For this test, I configured it to 10 concurrent users and a ramp up time of 10 seconds:
Then I created an HTTP Request sampler. This is the component that will generate load to an HTTP endpoint (any site of your choice, preferably one that is yours!)
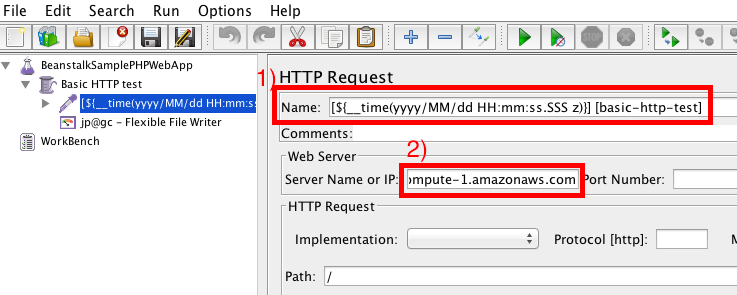
- Note that I am attaching a timestamp to the name of this sampler. I am using the JMeter
time()function and the timestamp format ‘yyyy/MM/dd HH:mm:ss.SSS z’. This is important as it tells JMeter to include a timestamp of this particular format in each record, together with the ‘sample name’ field. Make sure the timestamp and the sample name are enclosed between brackets ‘[]', like this:[${__time(yyyy/MM/dd HH:mm:ss.SSS z)}] [basic-http-test] - Server name or IP. Here I included the public DNS of my load target (the website I am sending HTTP requests to).
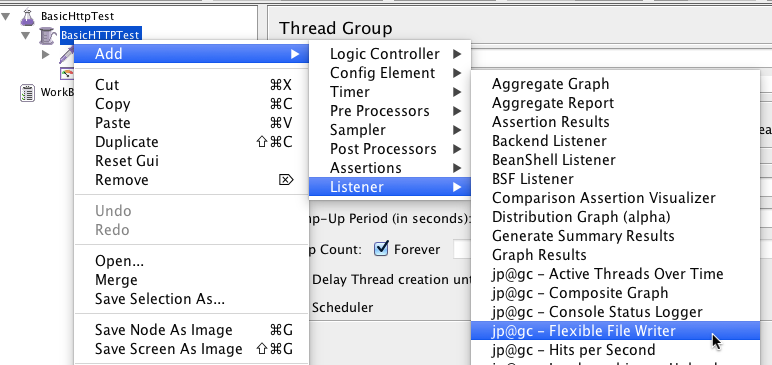
Add Flexible File Writer for your JMeter test plan
This plugin allows you to output test results to a log file in any format you choose. I found it handy since it lets me configure test results in the format CloudWatch Logs expects (more on that later)
The first thing we have to do is add Flexible File Writer to the test plan:
… then configure the plugin:
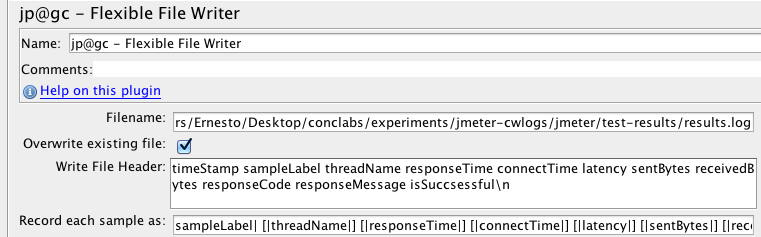
- Filename: this is the destination of your log file (in this example, “results.log”)
- Write File Header: these are the labels that will be included in the first row of your file. I recommend using a header row for troubleshooting purposes.
- Record Each Sample As: this is the order in which the result fields will be written to the log file. We will follow the same field order when we configure CloudWatch logs. This is where I configure the brackets and the space delimiter. I configured the fields using the following pattern:
sampleLabel| [|threadName|] [|responseTime|] [|connectTime|] [|latency|] [|sentBytes|] [|receivedBytes|] [|responseCode|] [|responseMessage|] [|isSuccsessful|]\n
Once this is configured, we can run a quick test…
Running JMeter
First, I recommend validating that the test case is configured properly. For this you would have to run a test in your local computer, using the GUI. You only need to click on the green triangle button in the JMeter GUI:

After a few seconds you can check your test results in the log file you specified when configuring Flexible File Writer. If JMeter is configured properly, the result log should print all fields enclosed in brackets and space-delimited, something like this:
timeStamp sampleLabel threadName responseTime connectTime latency sentBytes receivedBytes responseCode responseMessage isSuccsessful
[2016/02/08 16:51:05.265 CST] [basic-http-test] [BasicHTTPTest 1-1] [3301] [218] [1256] [66] [22442] [200] [OK] [1]
[2016/02/08 16:51:05.356 CST] [basic-http-test] [BasicHTTPTest 1-2] [3748] [571] [1584] [66] [22442] [200] [OK] [1]
[2016/02/08 16:51:05.678 CST] [basic-http-test] [BasicHTTPTest 1-4] [1361] [945] [1279] [66] [22442] [200] [OK] [1]
If everything looks good, you can copy your local .jmx test file (in this example I named it “basicHttpTest.jmx”) to your EC2 instance. Don’t forget to update “Filename” in Flexible File Writer first, so it points to the location of your results log file in the EC2 instance (and not the value you configured for your local computer).
You can upload your test plan to the EC2 instance by running the following command:
scp -i <full path of your .pem file> <full path of JMeter .jmx file> ec2-user@<public IP of EC2 instance>:~/jmeter/test-plans
If you installed JMeter using the CloudFormation template, you would run this command (I like using nohup and running the test in the background):
nohup /home/ec2-user/jmeter/apache-jmeter-2.13/bin/jmeter -n -t /home/ec2-user/jmeter/test-plans/basicHttpTest.jmx &
Make sure JMeter is writing results to the Filename specified in the JMeter test plan.
You can stop the test by running:
/home/ec2-user/jmeter/apache-jmeter-2.13/bin/shutdown.sh
The full documentation on how to get started with JMeter is here.
Validate that test results are published to CloudWatch Logs
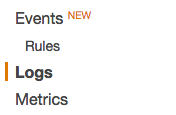
Once you start the JMeter test, let’s take a look at CloudWatch Logs. First go to the CloudWatch console and click on Logs in the left navigation bar.
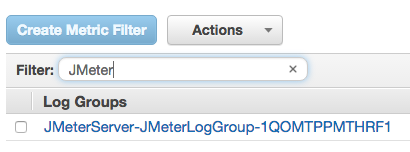
This will display a list of Log Groups. In this screenshot we can see the Log Group that was created by the CloudFormation template:
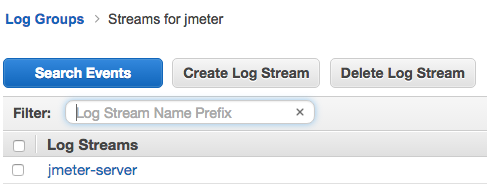
If I click on this Log Group, there is a list of Log Streams. In this case we are looking at the ‘jmeter-server’ log stream that was created by CloudFormation.
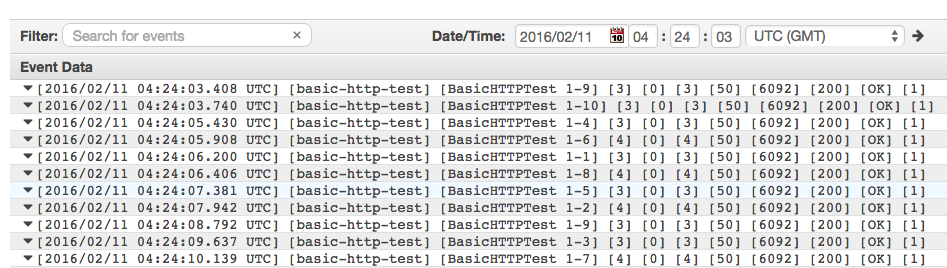
…and here we can see the contents of the JMeter results log, which have been exported to CloudWatch Logs! Note that each field is enclosed in brackets and is space-delimited (this is important for creating metrics from log entries); also note the timestamp format. This means the CloudWatch Logs agent parsed the timestamp from the JMeter log file properly. In short, everything looks good…
CloudWatch Logs Filters and Metrics
And now the final step. At this stage we can see our log records flowing nicely into CloudWatch. Log entries are parsed and transformed into CloudWatch metrics using metric filters. These filters are automatically created by the CloudFormation template.
The official documentation on metric filters is here.
CloudWatch Dashboard
Now that we have CloudWatch metrics, we can add them to a CloudWatch Dashboard for easy visualization:
One thing to consider is that CloudWatch does not offer metric math, such as P99, P50, variance, etc. If those metrics are critical to your test results, then you would have to implement a process that calculates metric math. I’m planning to implement a solution to this problem and write a post about it.
Once you’re done testing, don’t forget to delete your CloudFormation stack, so you stop paying for the resources you have created.
To summarize:
You can automate the creation of CloudWatch metrics from JMeter test results. This will enable you to analyze how user load will affect your customer experience and you will be able to diagnose and correct performance issues uncovered during load testing. Also, having your test results in CloudWatch will make it easier to implement test automation and DevOps tasks in your AWS cloud infrastructure.
There are many steps involved in this example which you can do manually or using CloudFormation. The steps are the following:
- Launch an EC2 instance with an EC2 Instance Profile attached to it.
- Install JMeter and Flexible File Writer
- Create a JMeter test plan and use Flexible File Writer to write the test results into a log file.
- Install and configure the CloudWatch Logs Agent so it reads from the JMeter results log file and exports log data into CloudWatch Logs
- Create metric filters, so CloudWatch Logs parses incoming log data and creates metrics.
- Organize your metrics in a CloudWatch dashboard for easy visualization (optional)
Where to go from here:
There are some cool things you could do next, such as:
- You can modify the CloudFormation template so it loads a test plan of your own (you can add a parameter to the template). You can also modify the User Data section to start a JMeter test on instance launch. This way you can kickstart performance tests from a deployment pipeline and get actionable results in CloudWatch without executing a single manual step.
- Create a CloudWatch Logs subscription to Kinesis or AWS Lambda for further processing of your log data. More information on that is here.
- You can stream log data to ElasticSearch, which could be really handy for further visualization and search capabilities (using Kibana). Read here.
- You can also export your log data to S3, for storage.
- You can create alarms that trigger or cancel deployment activities based on your test results. For example, if you start seeing HTTP 500 erros, automatically roll back a deployment or send a notification.
Are you launching soon or want to make sure your products don’t crash?
I can certainly help you with planning, designing, executing and fine-tuning load scenarios for your application. Just click on the Schedule Consultation button below and I’ll be glad to have a chat!