What is AWS QuickSight and why should I care?
QuickSight is a Business Intelligence service offered by AWS. It gives you some cool visualization tools and a platform to perform complex analysis on large datasets. QuickSight was first announced in 2015 in preview mode and it was made Generally Available on November, 2016.
I’m always looking for ways to lower AWS cost for my clients, which means I’m constantly doing AWS billing analysis. AWS offers a built-in cost analysis tool, AWS Cost Explorer. While AWS Cost Explorer gives me a good overview of monthly bills, I often need more than that. I’ve tried other good alternatives, but they either involve giving away all customer billing data to 3rd parties (which not everyone feels comfortable doing), or the overhead of setting up AWS infrastructure (like an Elasticsearch cluster, for example).
QuickSight is a great match for cost optimization in AWS, since analyzing billing data can become a complex problem very quickly. The type of problem that requires processing large and complex data sets and having the ability to analyze and visualize this data effectively.
When I heard about QuickSight, I was very happy to have an AWS fully managed alternative to AWS Cost Explorer. I just want to easily import data, analyze it and lower my clients’ AWS bill. Rinse and repeat :-)
The basics
Before we get started, let’s clarify some important concepts for AWS billing analysis.
Types of AWS billing reports.
If you find AWS billing reports confusing, you’re not alone. So let’s first clarify the types of AWS billing reports.
- AWS Cost and Usage. These are the ones we’ll analyze using QuickSight. This is a .csv file that is delivered to an S3 bucket of your choice approximately once per day. It contains usage and cost data for all your AWS resources.
- EC2 Instance Usage. GUI-based report that focuses on EC2 instances cost and usage. It’s not very useful, since it doesn’t give you anything other than instance hours. You can download it as a .csv if you want.
- EC2 Reserved Instance Utilization. GUI-based report that focuses on Reserved Instances. It’s kind of useful if you’ve purchased Reserved Instances, but that’s it.
- AWS Cost Explorer. GUI-based tool where you can visualize billing data by service, usage type and other dimensions. This is a good starting point to see what’s going on with your AWS bill, but it’s often not enough if you want to get to the bottom of what’s causing a high AWS bill.
- AWS Detailed Billing. These are .csv files delivered to an S3 bucket of your choice. In their documentation, AWS doesn’t recommend using them (which is kind of odd). They instead recommend using AWS Cost and Usage Reports, so that’s what we’ll do.
Setting up the AWS Cost and Usage Report
The first thing you’ll need is to have AWS Cost and Usage Reports enabled in your account. You’ll need to create an S3 bucket, configure its permissions and enable AWS Cost and Usage Reports in the AWS Billing & Cost Management Dashboard. This is a relatively straight-forward procedure and you can find more details about it here.
Make sure you select “Hourly” as the time unit and that you check the “Include Resource IDs” option. For this exercise, the more granular the data, the better. Also, make sure the boxes for “Redshift” and “QuickSight” support are enabled.
QuickSight concepts
You can find the full documentation here, but here are the basic concepts to get you started:
- Data Source. Location of the data you will import into QuickSight. This can be an S3 bucket, Athena database, RDS database, your own database, Salesforce.com data, or you can directly upload your files. For billing analysis, your data source will be the S3 bucket where your AWS Cost and Usage Report files are placed. It could also be a Redshift cluster (if you already load billing data to Redshift).
- Data Set. Specific data in a particular data source. For example, a specific file in S3 or a specific set of files in S3, or a specific table in your database.
- Analysis. The actual graphs and widgets that you’ll use to analyze the data in one or more data sets.
Being an AWS product, QuickSight comes with permissions management for data integrations using IAM mechanisms, such as IAM users and resource policies.
Creating a QuickSight manifest file
You’ll have to wait around one day for the AWS Cost and Usage files to be sent to S3. Once you confirm your S3 bucket has the reports you need, you’ll have to create a manifest file. You’ll use this manifest file to tell QuickSight where to look for data files in S3.
You can find more information about QuickSight manifest files here.
And now, here’s how I’ve used QuickSight to analyze billing and usage data…
Example - predicting cost with data from load tests
I always execute load tests. I use them to know if a system can handle real transaction volume in production. One great thing about load tests in the cloud is that you can use them to predict how much your applications will cost you once they’re handling real production traffic. A good load test analysis not only includes response times and all the good stuff that performance engineers like to measure - it MUST also include AWS cost predictions.
The test
I ran a load test against a WordPress site, consisting of 100 concurrent users and a random think time of 15 to 30 seconds between requests. This transaction volume results in approximately 10 million page views per month. The setup includes a number of t2.large EC2 instances managed by Auto Scaling behind an ELB and using RDS as a database server. After some time, I increased the number of users to 500, in the following way:
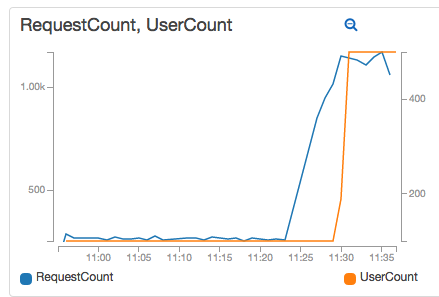
During load tests, I always take a look at the metrics published by my near real-time price calculator. This tool gives me a decent approximation of how much my systems will cost at the current transaction volume, with a 10-minute delay, instead of waiting one full day for the official AWS Cost and Usage report.
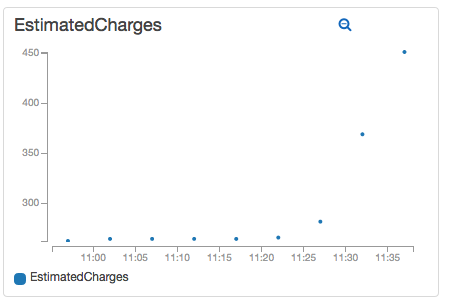
As much as I like my price calculator, the only way to be 100% sure about cost is to analyze AWS Cost and Usage report data. I’m going to use Quicksight to do just that.
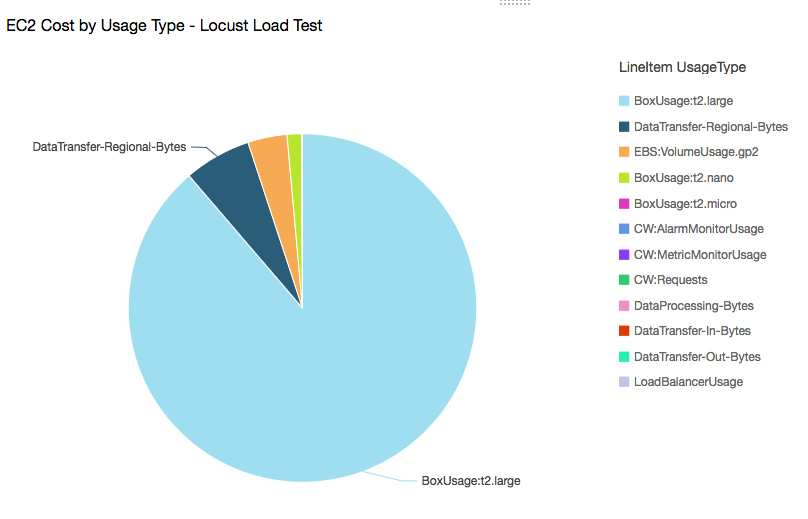
With QuickSight, I can drill-down to the actual hour when my test took place and get a good overview of where my money went:
Using Cost Explorer, I wouldn’t have been able to see hourly usage.
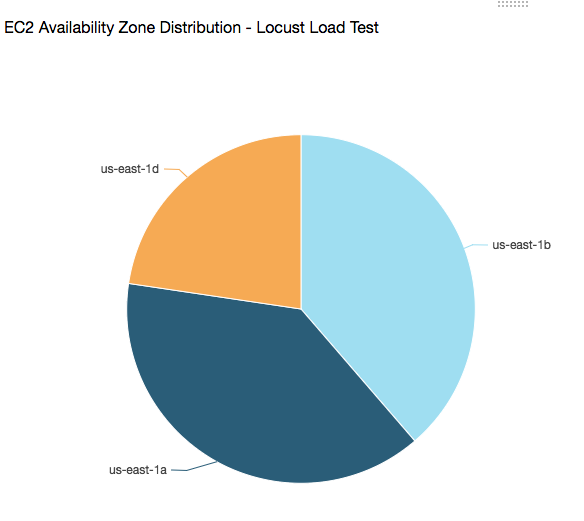
What if I want to see the AZ distribution during my test? With this graph I would’ve been able to see any anomalies in the test and correct them before going live.
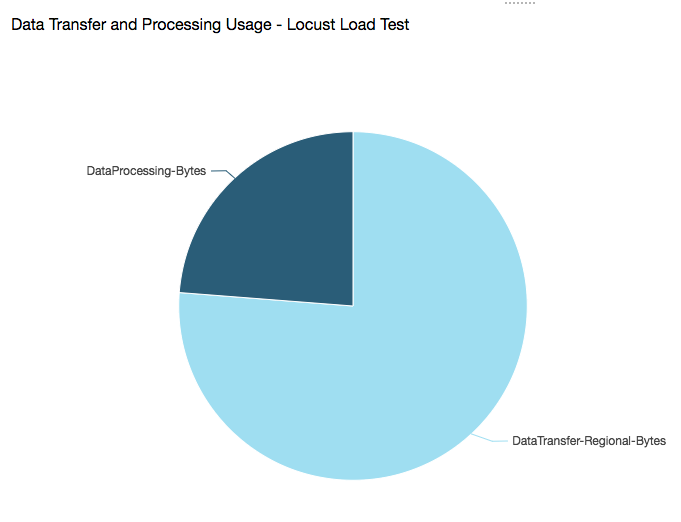
How about Data Transfer and ELB Data Processed? These two usage types are the culprit behind many bad AWS billing surprises. Unlike EBS storage or EC2 instance hours, data usage is hard to measure and predict, unless you execute realistic load tests, gather usage metrics and then make cost predictions using actual AWS data.
Since QuickSight enables me to see my usage numbers during my test window, I can easily estimate my monthly AWS cost based on real application behavior. As expected, EC2 data transfer is intra-region (from RDS to the EC2 instances, and from the EC2 instances to the ELB). The rest is ELB Data Processed (incoming data from EC2 instances and out to the internet)
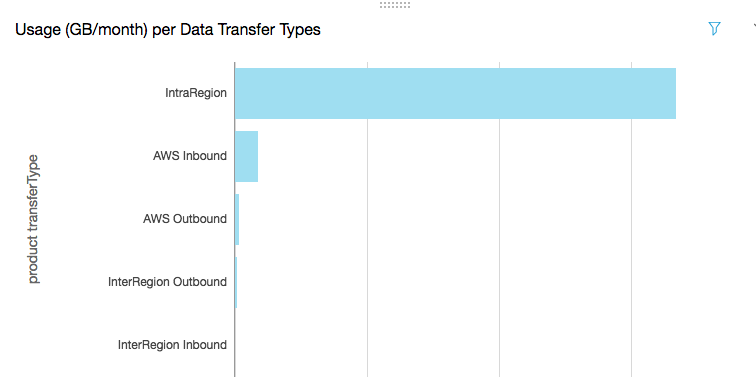
Here is a different chart where it’s easier to see the actual values:
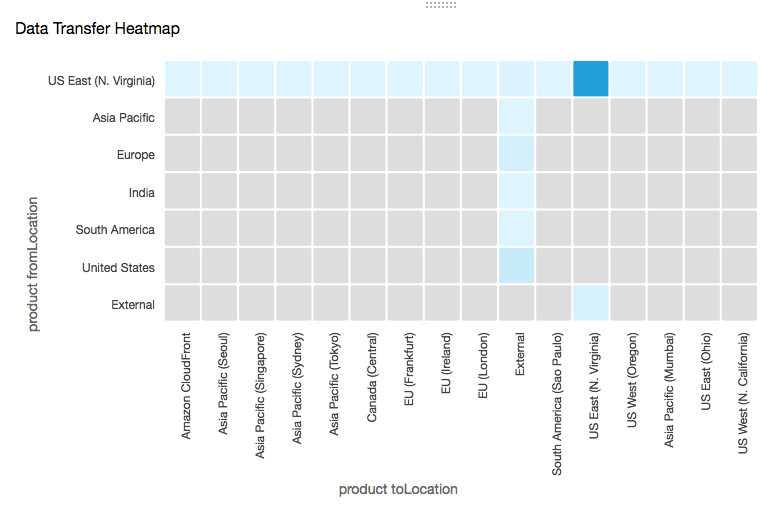
Here is a heatmap that tells me where my data went during the test. As expected, most of the data took place inside N. Virginia and out to the internet:
I can also save this report and prepare a dashboard that I can review with my team, or a client.
QuickSight is an essential tool for doing detailed AWS billing analysis, predicting and optimizing cost. I can use it with data generated during load tests or real production usage. Using QuickSight to analyze AWS Cost and Usage reports allows me to review and visualize data that I wouldn’t have been able to uncover by using AWS Cost Explorer alone.
Here are my conclusions:
Advantages of QuickSight over AWS Cost Explorer
More and better graphs
AWS Cost Explorer only has 3 graphs: vertical bar, stacked vertical bar and line. QuickSight has way more options, including horizontal (single and stacked), vertical (single and stacked), pie, line, area line, pivot table, heat map, scatter plot, tree map.
More options to group data by
AWS Cost Explorer gives you the option to group data by: API Operation, Availability Zone, Instance Type, Purchase Option, Region, Service, Tag, Usage Type.
In QuickSight, you can group and display data by any of the more than 90 fields included in the AWS Cost and Usage Report.
Better report granularity
QuickSight lets you drill-down to the actual hour an event took place. AWS Cost Explorer only displays usage and cost per day.
More options to measure data by
AWS Cost Explorer (as its name implies) only gives you the option to see the cost incurred by any of the supported data dimensions (Service, API Operation, etc.) Sometimes this is not enough - especially when you want to find inefficiencies in usage. For example, you want to find patterns in data transfer types that will help you optimize your application. Or patterns in certain API calls or EBS storage types. You won’t be able to get to this level of detail using the AWS Cost Explorer.
You can filter by AWS Resource ID.
Sometimes you need to drill down to specific EC2 instances, Dynamo DB tables or S3 buckets that are having a big impact on cost. The AWS Cost Explorer won’t be enough to get this type of analysis done.
You can create dashboards.
With QuickSight you can create rich dashboards where you can visualize multiple graphs at once. This is definitely a time saver when analyzing and presenting conclusions to your team or clients.
Advantages of AWS Cost Explorer over QuickSight
Ready to use
With the AWS Cost Explorer, you don’t have to set up data sources, data sets or anything like that. Basic graphs are ready for you to analyze and get some good insight into what’s going on with your AWS expenditure.
AWS Cost Explorer is free
QuickSight has a monthly cost of $12 if you pay monthly, or $9 if you commit to a full year. Although, if you value your time and the amount of money you can save by optimizing cost, the QuickSight fee becomes irrelevant. Also, you can use QuickSight for other detailed analysis, such as CloudTrail or VPC Flow Logs.
It can be painful to create Data Sets in QuickSight
It can take some time for QuickSight to load a full month worth of billing data. QuickSight is not a mature product yet, and it shows. I’m still inclined to use it for future billing analysis. Although it should be easy to get started, keep in mind there is a learning curve.
Missing QuickSight features that would make things better
- Access to an API. I want to automate the creation of data sources, data sets and visualizations.
- Ability to copy analysis. Using a new data set means you have to recreate visualizations in an analysis. Having a functionality to copy analysis and then update the data source would save a lot of time.
- Support in the GUI for bulk management actions on Data Sets. Sometimes I end up with multiple data sets that I want to delete or update. It’s annoying having to do these operations one-by-one. Instead, a bulk delete or refresh functionality would make things easier for power users.
- Faster data load times. Maybe I’m being too picky, but sometimes it can take more than a few minutes to load data sets into QuickSight. I know, loading 1 million records a few years ago would’ve taken a lot of people and at least a full day… but this isn’t 1995, right? Maybe enable notifications when data is ready?
To summarize
If you’re considering QuickSight, this table summarizes some common use cases and which tool would be a better option:
| Use Case | Best tool |
|---|---|
| I want a high-level visualization of my AWS spend by service | Cost Explorer |
| I want to know where my money’s going without doing any type of setup | Cost Explorer |
| I don’t want to spend any amount of money for cost analysis | Cost Explorer |
| I’m OK with spending $9-$12 per user monthly + $0.25/GB so I can do detailed billing analysis | QuickSight |
| I want to see usage units (not just cost) | QuickSight |
| I want more than just bars and line charts | QuickSight |
| I’m OK with filtering or grouping my data using only the following fields: AZ, API Operation, Instance Type, Purchase Option, Region, Service, Tag, Usage Type | Cost Explorer |
| I want to filter or group my data using any of the > 90 fields available in the AWS Cost and Usage Report | QuickSight |
| I need by-the-hour granularity | QuickSight |
| I’m OK with daily granularity and don’t need more than | Cost Explorer |
| I want to create and save dashboards where I can see multiple graphs at once | QuickSight |
From my experience, AWS Cost Explorer is a good tool to know what’s going on, quickly detect any anomalies in your AWS spend and to do some basic troubleshooting. If you really want to find out what’s behind a high AWS bill and you want to find solutions, you’ll need something more detailed, such as AWS QuickSight.
Do you need help with AWS cost optimization?
Have you experienced a bad AWS billing surprise? Or want to avoid one? Do you feel like you’re spending more than you should in AWS, but don’t know how to fix it or don’t have the time to do it?
I can save you a lot of money. Just click on the button below to schedule a consultation or use the contact form.