Athena is a very handy AWS service that lets you query data that is stored in S3, without you having to launch any infrastructure. Just put data files in S3 and let Athena do its magic. It’s awesome. You can use standard SQL syntax to query large data sets stored in S3.
That’s why it’s a great tool for doing detailed analysis on AWS Cost and Usage reports.
The bad news? Using Athena for AWS billing analysis is not as straightforward as it sounds. That’s why in this article I’m sharing steps that simplify the whole process, including tools I’ve built for my cost optimization activities.
Ok, but why should I care about this?
Cost analysis and optimization are some of the most critical tasks you have to perform regularly in your AWS account. As your applications grow, any cost inefficiencies will be amplified. These inefficiencies have the potential to really hurt your bottom line. That’s why it’s important to stay on top of any anomalies related to AWS cost.
AWS provides built-in tools to view your cost, such as Cost Explorer. However, a detailed cost optimization project often needs more than that. That’s where AWS Athena comes into place.
Important AWS concepts used in this article
- AWS Athena. This is an AWS service that lets you use SQL syntax to query data stored in S3. In theory, all you have to do is put data files in S3, declare a table in Athena and you should be able to query your data. In practice, it’s not always as easy as that.
- AWS Cost Explorer. This is the GUI that AWS built for cost analysis. It’s available in the billing section of the AWS Management Console. It gives you a number of graphs that you can filter and group by a number of parameters, such as Service, Usage Type, API, Instance Type, Region, Purchase Option, among others.
- AWS Cost and Usage Report. This is a CSV file that is delivered to an S3 bucket of your choice, approximately once per day. It contains raw usage and cost data for all of your AWS resources. This is the data that we’ll analyze using AWS Athena. Depending on your AWS usage, this dataset can grow into hundreds of thousands - even millions- of records each month. This is where a tool like Athena can very helpful.
Basic Athena concepts
As mentioned earlier, AWS Athena lets you query data stored in S3 using standard SQL syntax. It’s a great service, but in practice it’s a bit more complicated than that.
- Athena is built in Presto, an open source engine for running queries against large data sets.
- You need to create a table in Athena, which points to an S3 bucket. When you create a table, you also specify the data format, so Athena can parse the files stored in S3.
- Once a table is created in Athena, you can use standard SQL syntax. There are records and columns, just like any other relational database you might be familiar with.
Setting up the tools for AWS Cost and Usage analysis using Athena.
AWS Athena is relatively easy to use, but there are a number of steps you’ll need to take before you can use it to analyze AWS Cost and Usage data.
That’s why I created a GitHub repository with tools that make the whole process much easier. It also has detailed installation instructions.
See tools and instructions in GitHub
At a high level, the process consists of the following steps:
1. Enable AWS Cost and Usage Reports
AWS Cost and Usage reports are not enabled by default in your AWS account, therefore you have to enable them. You can do this from the AWS Billing console (instructions are available in the GitHub repo).
2.Prepare AWS Cost and Usage data before making it available to Athena
Doing AWS Cost and Usage analysis in Athena is not as easy as simply waiting for the next report and then querying the files. Here are some restrictions and considerations you need to know:
- Make sure your IAM user and S3 buckets have the right permissions for Athena to access them. Please refer to the Athena documentation.
- Athena doesn’t like non-data files in the S3 bucket and folder where data resides. Every time a new Cost and Usage report is generated, AWS creates a manifest file, which contains metadata. This manifest file is copied in the same location where the main data file lives, which interferes with how Athena queries data stored in the S3 bucket.
- AWS Cost and Usage reports are generated in CSV format, with a header row. Athena supports the OpenCSVSerde serializer/deserializer, which in theory should support skipping the first row. But for some reason, when the “skip.header.line.count” property is set, Athena doesn’t skip the first row.
That’s why I had to create a script that performs the following tasks:
- Copy only the latest data files to a different S3 location - don’t copy manifest files.
- Remove first row from data files.
Without executing this script, Athena won’t work for analyzing AWS Cost and Usage reports.
You can see the detailed installation instructions documented in the GitHub repository.
See tools and instructions in GitHub
3. Create Athena table
Once your files are in S3, all you have to do is create a database (or specify an existing one). Then you can create a table. You can do this from the Athena console. The GitHub repo has a SQL statement that creates an Athena table for AWS Cost and Usage analysis.
Note this Athena table is partitioned by month. For more on Athena partitions, read this.
4. Execute queries against your AWS Cost and Usage data!
That’s it, once you create the Athena table you’re ready to query your AWS Cost and Usage data. You can use the Athena console to execute queries, which is fine to get you started. After a while you might feel like using a JDBC client, such as SQL Workbench. You can refer to Athena’s documentation on how to do this.
I put some sample queries in the GitHub repo.
Examples of what you can do
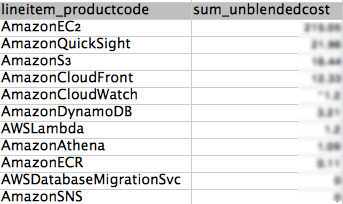
Get cost by AWS service
This is a very basic view, also available in Cost Explorer. One advantage of using Athena is that you can display as many services as you want, while Cost Explorer typically displays the top 5 or 6.
SELECT lineitem_productcode,
	round(sum(cast(lineitem_unblendedcost AS double)),2) AS sum_unblendedcost
FROM billing.hourly
WHERE period='<period>'
GROUP BY  lineitem_productcode
ORDER BY  sum_unblendedcost DESC
This is just a starting point, but it will show you useful information. “I thought I was done with X service, why amy I paying for it?", “I didn’t know Y service could get so expensive”. This is information you will find in your AWS invoice, but here it’s easier to visualize. Here is some sample data from a test account:
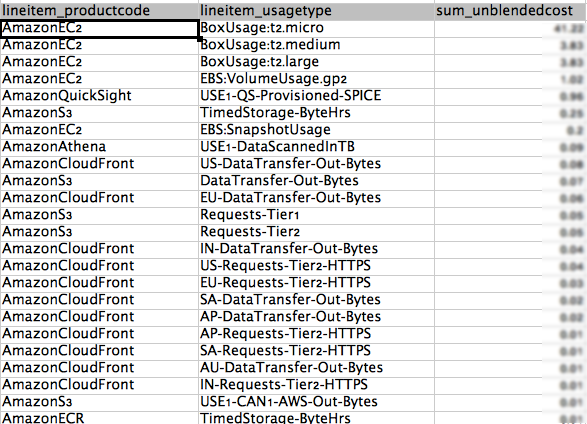
View cost by AWS Service and Usage Type
This view is partially available in Cost Explorer. Cost Explorer shows cost by usage types but not the service itself (at least not in the same graph). The service is inferred based on the usage type, but it’s not always clear. There are cases, such as data transfer, that can be associated with multiple services (EC2, S3, RDS, etc.) With this Athena query, you can see the actual service associated with each usage type and implement optimization tasks accordingly.
SELECT lineitem_productcode, lineItem_UsageType,
         round(sum(cast(lineitem_unblendedcost AS double)),2) AS sum_unblendedcost
FROM billing.hourly
WHERE period='<period>'
GROUP BY  lineitem_productcode, lineItem_UsageType
ORDER BY  sum_unblendedcost DESC
Things start to get interesting in this view, since I can spot usage patterns that contribute the most to my AWS bill. “Did I forget to turn off that c3.4xlarge instance?", “Why am I paying that much for S3 API requests?", “Do I really need to keep those EBS snapshots?”
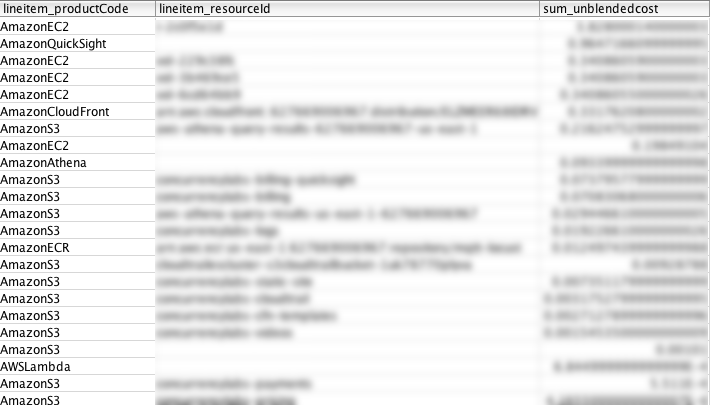
View cost by Resource ID
Resource IDs are not available using AWS Cost Explorer. This query is useful if you want to find those resources that incur in the highest cost (EC2 instances, S3 buckets, etc.) Using this query you will uncover situations that are not easy to see. For example, a rogue EC2 instance or S3 bucket. You can also use this query to see the number of active resources in your account.
SELECT lineitem_productCode,
         lineitem_resourceId,
         sum(cast(lineitem_unblendedcost AS double)) AS sum_unblendedcost
FROM billing.hourly
WHERE period='<period>'
GROUP BY  lineitem_productCode,lineitem_resourceId
ORDER BY  sum_unblendedcost desc
LIMIT 100
“Why is this particular S3 bucket so expensive?", “I thought I would only pay $X per month for this EC2 instance, why is it more than that?", etc.
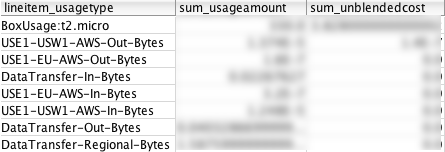
View usage by Resource ID
Once I find a problematic AWS resource, I can take a look at its actual usage types and cost incurred by each usage type. This is something I wouldn’t be able to do in Cost Explorer.
SELECT DISTINCT lineitem_usagetype, sum(cast(lineitem_usageamount AS double)) AS sum_usageamount,
  sum(cast(lineitem_unblendedcost AS double)) AS sum_unblendedcost
FROM billing.hourly
WHERE lineitem_resourceId = '<resourceId>'
AND period='<period>'
GROUP BY lineitem_usagetype
ORDER BY sum_unblendedcost DESC
This is one of my favourite queries, since it gives me information I can use to optimize my application and AWS components. “Too much data transfer out to the internet?", “Too many GET API calls to my S3 bucket?", “Paying too much for Standard storage class in S3?", “Too many read capacity units in my Dynamo table?", etc.
Take a look at all your AWS resources
Sometimes it’s useful to just see what stuff lives in your AWS account. You could obviously do this in the AWS console, navigate to all 100+ services and list all your resources. Or use the CLI. Or you can execute a simple query like the one below:
SELECT lineitem_productcode, lineitem_resourceId
FROM billing.hourly
WHERE lineitem_resourceId <> ''
AND period='<period>'
GROUP BY lineitem_productcode, lineitem_resourceId
GROUP BY lineitem_productcode
View cost incurred chronologically
Cost Explorer lets you see cost by day, but not by hour. If you want to see hourly patterns, events or anomalies, this query will help you find them.
SELECT lineitem_usagestartdate, round(sum(cast(lineitem_unblendedcost AS double)),2) AS sum_unblendedcost
FROM billing.hourly
WHERE period='<period>'
GROUP BY  lineitem_usagestartdate
ORDER BY  lineitem_usagestartdate
AWS Athena vs. Cost Explorer
So, does it make sense to use Athena for AWS cost analysis and optimization? Cost Explorer is a great option to quickly get an overview of your AWS spend, but it’s often not enough for a more detailed analysis. The queries in this article are just some examples of situations where Athena offers an advantage over Cost Explorer. There are, however, some advantages that Cost Explorer offers.
Advantages of Cost Explorer
- Ready to use. You don’t have to set up any type of infrastructure to see graphs. Considering the number of steps you have to take if you want to use Athena, this is a great advantage.
- In many cases, graphs make visualization easier compared to query results. Cost Explorer has some decent graphs and the ability to group and filter data by parameters such as: API Operation, Availability Zone, Instance Type, Linked Account, Purchase Option, Region, Service, Tag and Usage Type.
In general, Cost Explorer gives you a great overview of where your money is going. However, it’s not enough if you really want to get to the bottom of some anomaly and correct it. For that, you’ll need to filter and group data by more parameters, such as specific hours or resourceIds, or specific values in your consumption or cost.
Advantages of AWS Athena over Cost Explorer
- You can do detailed analysis and get to the root cause of anomalies.
- SQL syntax gives you control and flexibility over which data you want to access.
- You can access data programmatically and automate report creation.
Advantages of AWS Athena over QuickSight
Here is an article I wrote about using QuickSight for cost optimization. Athena and QuickSight are different tools that complement each other and can be used for different types of tasks.
- QuickSight doesn’t have an API, so for programmatic access and automation Athena is still the best option. This means you can build some cool custom tools and reports on top of Athena.
- With my scripts, it’s easier to load Cost and Usage data into Athena compared to QuickSight.
- It’s not easy to create custom queries and filters in QuickSight. Doing so requires a lot of clicks and scrolling. Athena’s SQL interface will always give you more flexibility as to what data you want to access.
Advantages of QuickSight over AWS Athena
- SQL is not pretty, QuickSight graphs are. If you need to present or share data with other people, you can save nice dashboards and visualizations in QuickSight.
- There are widgets in QuickSight that give you very good information without you having to run custom queries. You still get something better than Cost Explorer, but without having to prepare SQL statements.
Cost
Athena costs $5 per 1TB of data queried. For manual analysis, it’s very reasonable. But if you’re using it for some automated process that executes large queries with a high frequency, you might incur in considerable cost over time. That’s why it’s important to use partitions when querying Athena. Less data queried by Athena means you’ll experience faster queries and lower your cost.
Cost and Usage data will only be updated once per day, so I’d recommend implementing some caching mechanism if you’re building an app that queries this information at a high volume.
You will also incur in S3 storage costs, at a rate of $0.023 per GB/month (for the first 50TB). In many cases this will not be significant, but it’s something to keep in mind if you have thousands of AWS resources or manage a high number of AWS accounts.
Given the money you can save in your AWS bill if you use Athena for analysis, its cost becomes almost irrelevant.
Do you need help with AWS cost optimization?
Have you experienced a bad AWS billing surprise? Or want to avoid one? Do you feel like you’re spending more than you should in AWS, but don’t know how to fix it or don’t have the time to do it?
I can save you a lot of money. Just click on the button below to schedule a consultation or use the contact form.