Sooner or later most application owners need to analyze large amounts of data. From system and application logs, to usage and business metrics or external datasets, there is always very valuable information to be extracted from many data sources. Therefore, chances are you or your team will have to take a close look at many of the Big Data analysis tools out there - if you aren’t already doing so.
The good news? Whatever your needs are, you’ll likely be covered. The problem? Handling and analyzing large amounts of data is inherently complicated, particularly in areas such as infrastructure setup (i.e. compute, storage, automation), data setup, learning curve, performance and potentially high cost.
In this article, I will focus on three very interesting tools designed to analyze large amounts of data: Starburst Presto, Redshift and Redshift Spectrum.
What are the main differences between these three solutions?
- Presto is an open source distributed ANSI SQL query engine. Presto supports the separation of compute and storage (i.e., queries data that is stored externally - for example, Amazon S3). Starburst Presto is an enterprise-ready distribution of Presto made available by Starburst Data, a company founded by many of the leading committers to the Presto project. Starburst Presto is also open source and closely matches the Facebook GitHub branch, but includes some additional features and bug fixes.
- Redshift is a managed data warehouse service delivered by AWS. Redshift stores data in local storage distributed across multiple compute nodes.
- Redshift Spectrum uses a Redshift cluster to query data stored in S3, instead of local storage.
In this article I will focus on Performance and Cost for these three solutions.
Measuring Performance
One of the key areas to consider when analyzing large datasets is performance. Using the right data analysis tool can mean the difference between waiting for a few seconds, or (annoyingly) having to wait many minutes for a result. Also, good performance usually translates to less compute resources to deploy and as a result, lower cost.
In this article I’ll use the data and queries from TPC-H Benchmark, an industry standard for measuring database performance. It consists of a dataset of 8 tables and 22 queries that are executed against this dataset. TPC-H offers a consistent way to measure performance against different database engines.
This means I used the same dataset and queries when testing Starburst Presto, Redshift and Redshift Spectrum, so we can have a fair comparison. I executed the standard TPC-H set of 22 queries, sequentially, on a 1TB dataset.
Infrastructure and Data Setup
A 1TB TPC-H dataset consists of approximately 8.66 billion records, for all 8 tables combined. Due to its size, querying a 1TB TPC-H dataset requires a significant amount of resources, therefore I set up a fairly powerful cluster for each solution:
- Starburst Presto running on EC2. 10 Worker nodes (r4.8xlarge) and 1 Coordinator node (r4.8xlarge). Each r4.8xlarge EC2 instance is memory-optimized and has 32vCPUs, 244GB RAM and 10 Gb/s network performance. Each node uses EBS as a root volume. In addition to Worker and Coordinator nodes, this Presto cluster uses an RDS-backed Hive Metastore in AWS EMR, consisting of 1 node (m4.large). A Hive Metastore stores metadata for tables, such as their schema, location, size and other internal characteristics. The metadata in the Hive Metastore is used by Starburst Presto’s Cost-Based Optimizer, which uses this information to determine the most optimal query execution plans.
- Redshift. One 10-node cluster with dc2.8xlarge instances. Each dc2.8xlarge instance has 36vCPUs, 244GB RAM and 2 volumes of 2 TB SSD Instance Storage each. The main difference between DC2 and R4 EC2 instances - besides the extra 4 vCPUs - is the way they handle storage. While R4 instances are EBS-backed, D2 instances use internal Instance Storage, which makes them a powerful solution for storing data. It’s worth noting that the Starburst Presto cluster in this test reads data from S3 and not from EBS.
- Redshift Spectrum. I used the same 10-node Redshift cluster, but made it point to the same ORC-formatted files in S3 that were also accessed by Starburst Presto.
Launching a Redshift cluster of this size is very straightforward and it only takes a few clicks. However, it can take 20 minutes or more for the cluster to be ready. Resizing an existing cluster can also take the same amount of time, most likely due to data being redistributed across nodes.
The Starburst Presto cluster on EC2 can be launched using a CloudFormation template and it can take literally a couple of minutes to have a cluster up and running, but you’ll also have to launch an EMR Hive Metastore. Using EC2 Auto Scaling, it is very simple to resize the cluster and it only takes a couple of minutes to do so, by updating Desired Capacity, Minimum and Maximum size of the Auto Scaling Group.
In my experience, launching a cluster for the first time is a bit easier in Redshift. After that, re-launching and resizing clusters is significantly easier using Starburst Presto on EC2. Since these clusters are expensive to run 24 / 7, re-launching and resizing will likely be a common task (more on that in the Cost Comparison section below)
Benchmark Execution
The TPC-H benchmark consists of a standard dataset and 22 queries that are executed sequentially against this dataset. For my test, I followed the following steps:
- Created the dataset using the tools made available by TPC.
- Copied those files into S3, where they can be accessed by each solution. For Starburst Presto and Redshift Spectrum, it’s only required to create tables that point to the S3 location of the data files. For Redshift, I had to create tables in Redshift and then load data from S3 into the Redshift cluster.
- I proceeded to execute all 22 queries in sequence. Each sequence was executed 3 times and the average of these 3 executions is reported in the results section. It is worth noting that there was no significant variance observed between each set of executions.
Here are my findings:
Starburst Presto 1TB (data stored in S3 in ORC format)
TPC-H data is created using Presto’s TPC-H connector and it is stored in S3 in ORC format (ZLIB compressed). Schemas and tables are registered in the EMR-powered Hive Metastore. The setup steps are as follows:
- First, I created a schema that points to an S3 location (
CREATE SCHEMA hive.tpch_1tb_orc WITH (location = 's3://<s3-bucket>');) - Then, I created and populated each one of the 8 TPC-H tables using Presto’s TPC-H connector (
CREATE TABLE hive.<schema>.<table> WITH (format = 'ORC') AS SELECT * FROM tpch.sf1000.<table>;)
After that, I executed all 22 queries and here are the results:
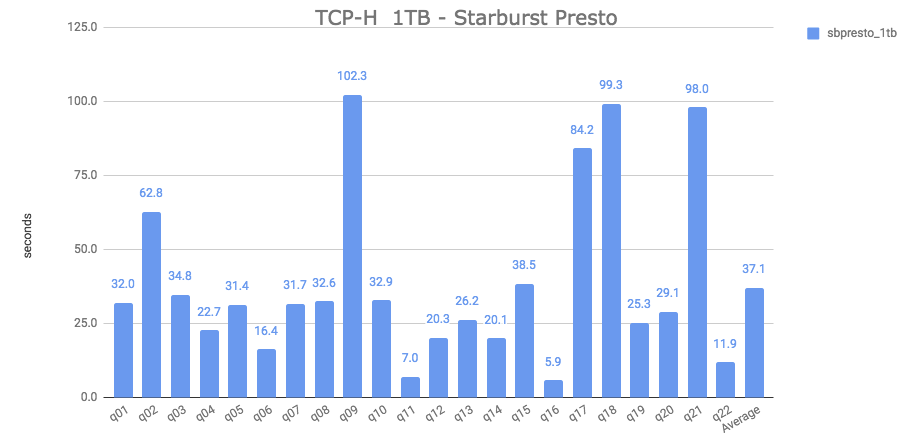 It took an aggregate average of 37.1 seconds to execute all queries.
Redshift Spectrum 1TB (data stored in S3 in ORC format)
For this Redshift Spectrum test, I created a schema using the CREATE EXTERNAL SCHEMA command and then created tables using the CREATE EXTERNAL TABLE command, pointing to the location of the same ORC-formatted TPC-H data files in S3 that were created for the Starburst Presto test above.
Here are the results:
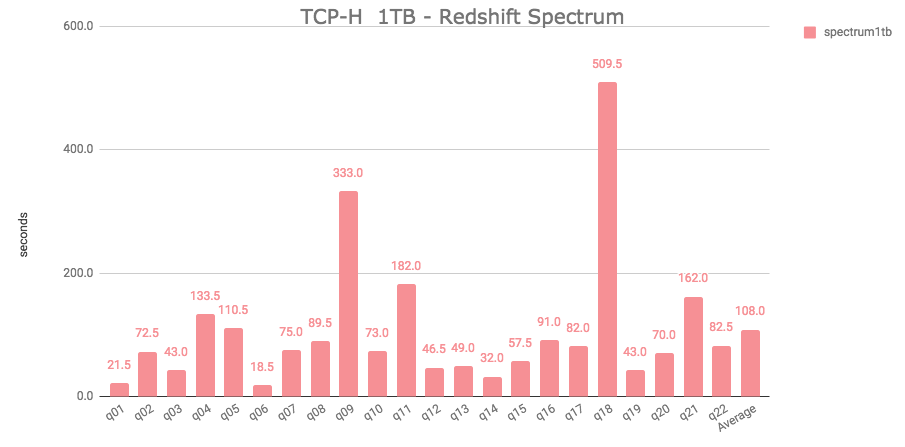
It took an aggregate average of 108 seconds to execute all queries.
Redshift (with data loaded into internal SSD storage)
For this test, first I created the dataset using TPC’s data generator utility (/dbgen -vf -s 1000). I created 10 files per table and zipped them before loading them into S3. I highly recommend splitting and compressing files before loading them into S3; it saves a lot of time and you’ll pay less money for S3 storage.
After data files were put in S3, I created tables in Redshift and executed a COPY command for each table (COPY <table> FROM 's3://<s3-location>' CREDENTIALS 'aws_access_key_id=<key-id>;aws_secret_access_key=<secret-key> delimiter '|';).
This command loads the files into the cluster, from S3.
Once files are loaded into Redshift, data gets queried from the local SSD storage in the cluster.
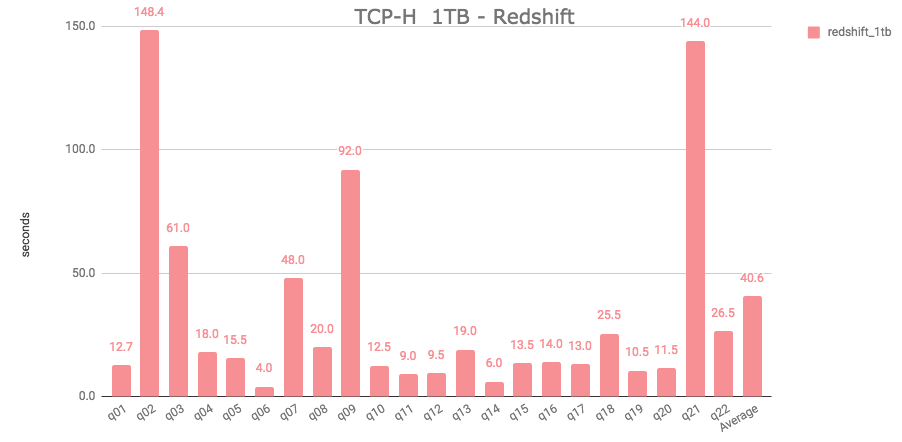
It took an aggregate average of 40.6 seconds to run all 22 queries. It is important to highlight that Redshift has some limitations regarding Correlated Subqueries, which affect how a query like q04 can be structured, therefore this particular query had to be modified. Presto doesn’t have the same limitations as Redshift regarding Correlated Subqueries.
Performance Comparison
And here is a performance comparison among Starburst Presto, Redshift (local SSD storage) and Redshift Spectrum.
Starburst Presto vs. Redshift (local storage)
In this test, Starburst Presto and Redshift ended up with a very close aggregate average: 37.1 and 40.6 seconds, respectively - or a 9% difference in favor of Starburst Presto.
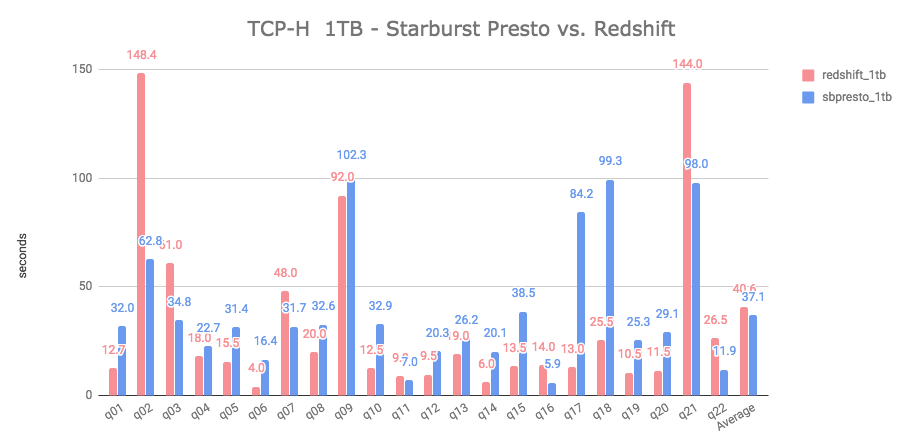
However, if you look at individual queries, Redshift finished first in 15 out of 22 queries. This is a very close match and my conclusion is that for practical purposes, there’s no real difference in the performance of these two solutions.
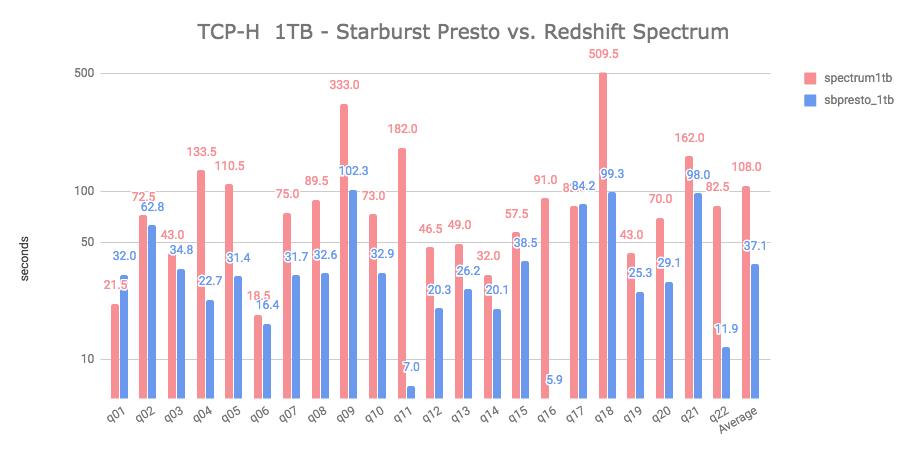
Starburst Presto vs. Redshift Spectrum (1TB ORC dataset stored in S3)
In this test, Starburst Presto outperformed Redshift Spectrum by a factor of 2.9 in the aggregate average. Also, Starburst Presto finished first in 20 out of 22 queries. In this comparison the clear winner is Starburst Presto.
All three combined:
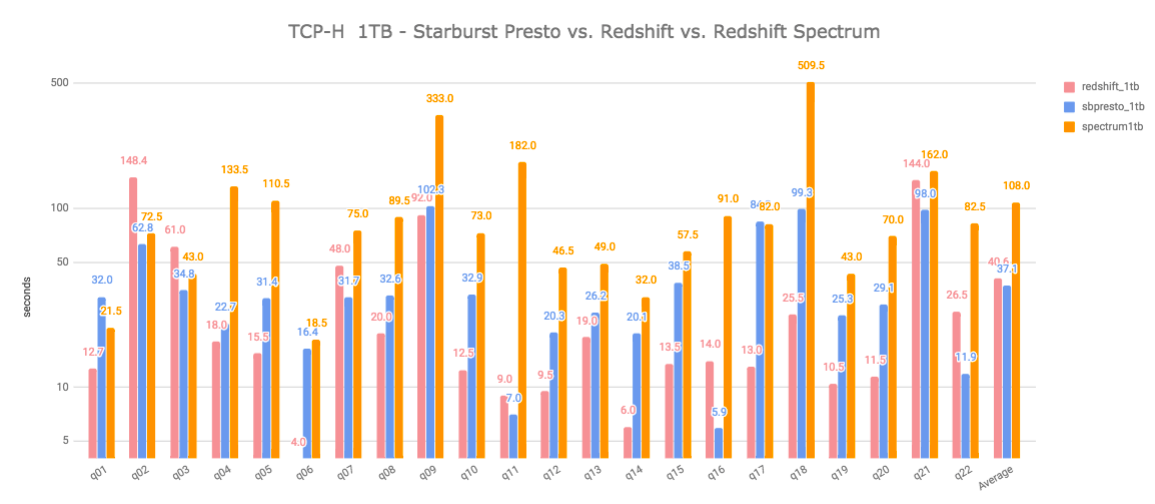
Below is a summary table with all individual query times, in seconds:
| query | redshift_1tb | sbpresto_1tb | spectrum_1tb |
|---|---|---|---|
| q01 | 12.7 | 32.0 | 21.5 |
| q02 | 148.4 | 62.8 | 72.5 |
| q03 | 61.0 | 34.8 | 43.0 |
| q04 | 18 | 22.7 | 133.5 |
| q05 | 15.5 | 31.4 | 110.5 |
| q06 | 4.0 | 16.4 | 18.5 |
| q07 | 48.0 | 31.7 | 75.0 |
| q08 | 20.0 | 32.6 | 89.5 |
| q09 | 92.0 | 102.3 | 333.0 |
| q10 | 12.5 | 32.9 | 73.0 |
| q11 | 9.0 | 7.0 | 182.0 |
| q12 | 9.5 | 20.3 | 46.5 |
| q13 | 19.0 | 26.2 | 49.0 |
| q14 | 6.0 | 20.1 | 32.0 |
| q15 | 13.5 | 38.5 | 57.5 |
| q16 | 14.0 | 5.9 | 91.0 |
| q17 | 13.0 | 84.2 | 82.0 |
| q18 | 25.5 | 99.3 | 509.5 |
| q19 | 10.5 | 25.3 | 43.0 |
| q20 | 11.5 | 29.1 | 70.0 |
| q21 | 144 | 98 | 162 |
| q22 | 26.5 | 11.9 | 82.5 |
| Average | 40.6 | 37.1 | 108 |
In terms of performance, it’s hard to pick a winner between Redshift (local storage) and Starburst Presto. Starburst Presto outperforms Redshift by about 9% in the aggregate average, but Redshift executes faster 15 out of 22 queries. Redshift Spectrum lags behind Starburst Presto by a factor of 2.9 and 2.7 against Redshift (local storage), in the aggregate average.
So, there’s no clear winner if we go by the performance numbers alone. However, it’s important to consider that Redshift queries data from local storage, while Starburst Presto does it directly from S3. I think both solutions can offer excellent performance.
There is, however, a big difference when it comes to cost…
Cost Comparison
Below are some AWS price calculations for each solution in N. Virginia (us-east-1). As you will see, cost can add up very quickly, for all of them. The chosen cluster size is appropriate to handle this 1TB dataset, but it also results in a high amount of compute power (and cost).
Starburst Presto
Below is the price calculation for the Starburst Presto cluster.
| Component | Price Dimension | Usage | Hourly Cost | Monthly Cost |
|---|---|---|---|---|
| Data store | S3 Storage | 1TB | $0.03 | $23 |
| Starburst Presto cluster | EC2 compute | 11 r4.8xlarge instances | $23.41 | $16,855.20 |
| Starburst Presto cluster | AWS Marketplace Fee | 11 licenses ($0.27 per hour, per server) | $2.97 | $2,138.40 |
| Hive Metastore | EMR instance | 1 m4.large (EC2 + EMR cost) | $0.13 | $93.60 |
| Hive Metastore | RDS Data store | 1 RDS MySQL t2.micro, 20GB SSD storage | $0.02 | $14.40 |
| Total: | $26.56 | $19,125 |
An important factor to consider is that EC2 supports per-second billing and the option to use Reserved and Spot Instances, which can lower compute cost significantly. Per-second billing is very handy when it comes to resizing clusters prior to doing an analysis, since you truly pay for what you use.
Cost Savings options in an EC2 cluster:
- Decide on whether to re-launch or resize. If you’re planning to use the cluster fairly regularly, then launching a new cluster each time might become a bit tedious - even if it only takes a few minutes to do so. Instead, you might want to keep the cluster to a minimum size most of the time and add nodes as needed. Even better, using scripts can save you a lot of time when launching or resizing a cluster.
- Buy Reserved Instances for the Presto cluster. First, estimate the number of hours that you expect the cluster to be up and running in a given month. Let’s say, you need it 4 hours per day on weekdays. That’s 80 hours per month x 11 EC2 instances = 880 compute hours. Buying 1 Reserved r4.8xlarge instance would save you money then. Anything below 430 hours (60% of hours in a month) will not justify buying a Reserved Instance, given expected savings are approximately 40% per year.
- If you decide to keep the cluster alive and just resize it as needed, then consider buying a Reserved Instance for the EMR Hive Metastore.
- Buying Spot Instances is also an option, if you don’t mind the possibility of a failed query due to an EC2 worker node being terminated in the middle of an execution. Given that EC2 Spot Instances can be as much as 80% cheaper compared to On-Demand, they’re worth considering as a cost savings measure.
Redshift Cluster (internal storage)
| Component | Price Dimension | Usage | Hourly Cost | Monthly Cost |
|---|---|---|---|---|
| Redshift cluster | Compute nodes | 10 dc2.8xlarge nodes | $48.00 | $34,560.00 |
| Total: | $48.00 | $34,560.00 |
As you can see, running a Redshift cluster is about 80% more expensive compared to running a Starburst Presto cluster on EC2.
Cost Savings options:
- Similarly to the Starburst Presto cluster, decide on whether to re-launch or resize. Just keep in mind that any of these operations can take 20-30 minutes in Redshift and result in downtime, compared to 2-3 minutes in EC2. Also, you might not be able to resize if the desired cluster size cannot handle the amount of storage in your cluster. For example, if you have 1TB of data, you can’t resize down to 3 small dc2.large nodes, since you wouldn’t have enough storage to accommodate 1TB.
- If you run analysis infrequently, you can shutdown the cluster, create a snapshot and restore it when needed. Again, it will take 20-30 minutes each time, but you’ll avoid spending close to $35,000 per month on a cluster this size.
- Reserved Instances are available in Redshift. Depending on the term and upfront fee option, savings can range approximately between 20% and 70%. You’ll have to calculate the number of Reserved Instances you’ll need based on the expected number of hours per month for the cluster.
- Redshift doesn’t support Spot Instances.
Redshift Spectrum
| Component | Price Dimension | Usage | Hourly Cost | Monthly Cost |
|---|---|---|---|---|
| Data store | S3 Storage | 200GB | $0.006 | $4.60 |
| Redshift cluster | Compute nodes | 10 dc2.8xlarge nodes | $48.00 | $34,560.00 |
| Total: | $48.00 | $34,560.00 |
In addition, Redshift Spectrum cost for data scanning off S3 is $5 per terabyte. The final cost of this solution will depend on how many queries are executed. As an example, running all 22 TPC-H queries once incurred in approximately 1.5TB of data scanned, or $7.50.
Cost Savings options:
- Same as above regarding Reserved Instances.
- Compressing files and using columnar format will reduce Redshift Spectrum cost (at $5 per terabyte scanned).
In general, something I don’t like about Redshift and Redshift Spectrum pricing is that it doesn’t support per-second billing. If you launch clusters regularly for specific tasks, you’ll end up paying for the last full hour, even if you only use a portion of it.
General cost saving recommendations
- Monitor AWS spend and set up CloudWatch Billing Alarms. The cost for any of the clusters described in this article can quickly add up, ranging between approximately $19,000 to $35,000 per month if they’re left running 24 / 7. If this happens by mistake, that would be what I call a bad AWS billing surprise! I highly recommend setting up CloudWatch Billing Alarms for different thresholds, according to your budget (i.e. $1,000, $2,000, $5,000, $10,000, etc.).
- Automate as much as you can. We now know cost can be high if these clusters are left running 24 / 7. On the other hand, regularly launching all these AWS components from scratch can be tedious and time-consuming. Therefore I recommend having a way to launch components with minimal effort. Using tools such as CloudFormation, Auto Scaling and custom automation scripts will simplify infrastructure setup and resizing.
Conclusions
- Performance between Redshift and Starburst Presto is comparable. Both Starburst Presto and Redshift (with the local SSD storage) outperform Redshift Spectrum significantly.
- The key difference between both Redshift solutions and Starburst Presto is in AWS infrastructure cost. Both Redshift and Redshift Spectrum are more expensive compared to running Starburst Presto on EC2, by about 80% (~$19,000 vs ~$34,500 per month, if left running 24 / 7, or $27 vs $48 per hour). EC2 also offers per-second billing, while Redshift only supports hourly billing.
- Having data that can be queried directly in S3 simplifies setup significantly. Since many solutions and architectures already place data in S3, it is very convenient to access this data directly in S3, without loading it anywhere else. Both Starburst Presto and Redshift Spectrum offer this advantage.
- Even though Redshift is a managed solution, it takes a long time to resize and launch clusters (20-30 minutes). Given that the cost of a cluster this size is quite high (> $34,500 per month if left running 24 / 7), you’ll likely have to often terminate or resize clusters when not in use.
- Resizing a Starburst Presto cluster can be done very easily using EC2 Auto Scaling and the overall resize operation takes only 2-3 minutes.
After executing this test and when I consider setup, performance, cost and flexibility to manage a data analysis cluster, in my perspective Starburst Presto offers a preferable solution compared to Redshift and Redshift Spectrum.