Last update: September 21st, 2016 - The CloudFormation template now supports Elasticsearch 2.3
When you’re working with third parties - either automated tools or service providers -, sooner or later you have to grant them access to your AWS account. Service providers (like me) eventually need to take a look at your AWS resources and execute API operations that list, describe, create or update components in your AWS account. For example, launching EC2 instances or creating CloudFormation stacks, monitoring CloudWatch metrics, updating Auto Scaling groups, etc.
There is obviously a degree of trust you must place in anyone before giving them permissions to your AWS components. But even then, it is important that you keep track of the operations that take place in your account. Thankfully, there are mechanisms to give you just that. The only problem is that they do take time to set up.
That is why this post shows an automated way that allows you to easily capture, store and visualize data on all the activity that takes place in your AWS account. I use this method with my clients, so there is full transparency on the operations that I execute as part of my services (and my clients don’t spend hours trying to set it up). My recommendation is that you follow a similar configuration when you grant a third party access to your AWS resources.
These are the basic AWS components you should care about:
IAM Roles
IAM roles are AWS’ standard way of granting cross-account access to your resources. With IAM roles you have 100% control over which operations can be executed by an external account and the exact AWS resources that can be accessed. There are many AWS services that require you to create an IAM role before they do anything on your AWS account. These services are actually an external entity to your account and you have to grant them permissions before they can view or update anything.
Before a third party does any work on your AWS account, the recommended mechanism to grant them permissions is IAM roles. Once the work is completed, you can revoke access immediately by updating the IAM access policy or deleting the IAM role.
CloudTrail
Once you grant access to third parties and we start doing work, it’s important that you know exactly what operations are executed on your AWS account - and that’s why CloudTrail is an incredibly useful tool. CloudTrail is AWS auditing mechanism and it logs every single API call that takes place in your account, including who called it, when and where from. Every single operation anyone executes (including third parties) will be logged in CloudTrail.
The only problem with CloudTrail is that it generates large amounts of data and has no built-in feature to analyze or visualize it. All you get from CloudTrail is a large number of JSON entries copied periodically to an S3 bucket or a CloudWatch Logs destination of your choice. Even though each record has very important information, having thousands of raw CloudTrail records is not very useful, unless you use some tool to analyze this data. Here is a sample record:
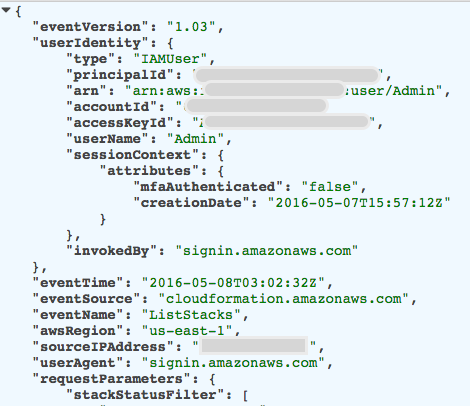
There are many tools on the market that let you visualize your CloudTrail logs, which is great. I will not cover those tools in this post; instead I will focus on using the AWS Elasticsearch Service.
AWS Elasticsearch Service
Elasticsearch is a very popular indexing and search solution. Deploy it in your servers, feed data to it and Elasticsearch automatically creates indexes that you can easily search. Elasticsearch comes with Kibana, a web-based visualization tool that you can use to create nice graphs and dashboards. Elasticsearch and Kibana combined are a great way to make sense out of CloudTrail data.
Using Elasticsearch and Kibana to visualize CloudTrail data is nothing new. AWS has published a blog post describing how to use Elasticsearch and Kibana with CloudTrail logs. There are many examples on the internet with some variations. However, the examples I could find were published before AWS released the AWS Elasticsearch Service. This means you would have to deploy and manage Elasticsearch servers yourself. Instead, I want to use a fully managed service such as AWS Elasticsearch.
The AWS Elasticsearch Service was announced last October at the annual re:Invent 2015 conference. It is a managed service that handles the deployment, operations and scaling of Elasticsearch for you on AWS. You tell AWS what type of Elasticsearch cluster you want, and AWS creates it and maintains it for you. It also integrates nicely with CloudWatch Logs using Subscription Filters, which means you can easily export CloudTrail data from CloudWatch Logs to AWS Elasticsearch. I will use this managed service instead of deploying and maintaining an Elasticsearch cluster myself.
CloudFormation
Creating an Elasticsearch domain and hooking it up with CloudTrail involves a lot of steps in multiple AWS services. That is the reason I created a CloudFormation template that automates the whole process. CloudFormation automates the creation and configuration of AWS resources using templates that are defined in JSON format, also known as “infrastructure as code”. By using CloudFormation, my clients only have to click on a link and fill out few fields in the AWS CloudFormation console instead of creating a lot of things in at least 6 different consoles. CloudFormation coordinates all the necessary steps and creates and configures all the pieces I define in the CloudFormation template. This simplifies the whole on-boarding process enormously.
This is what the architecture looks like:
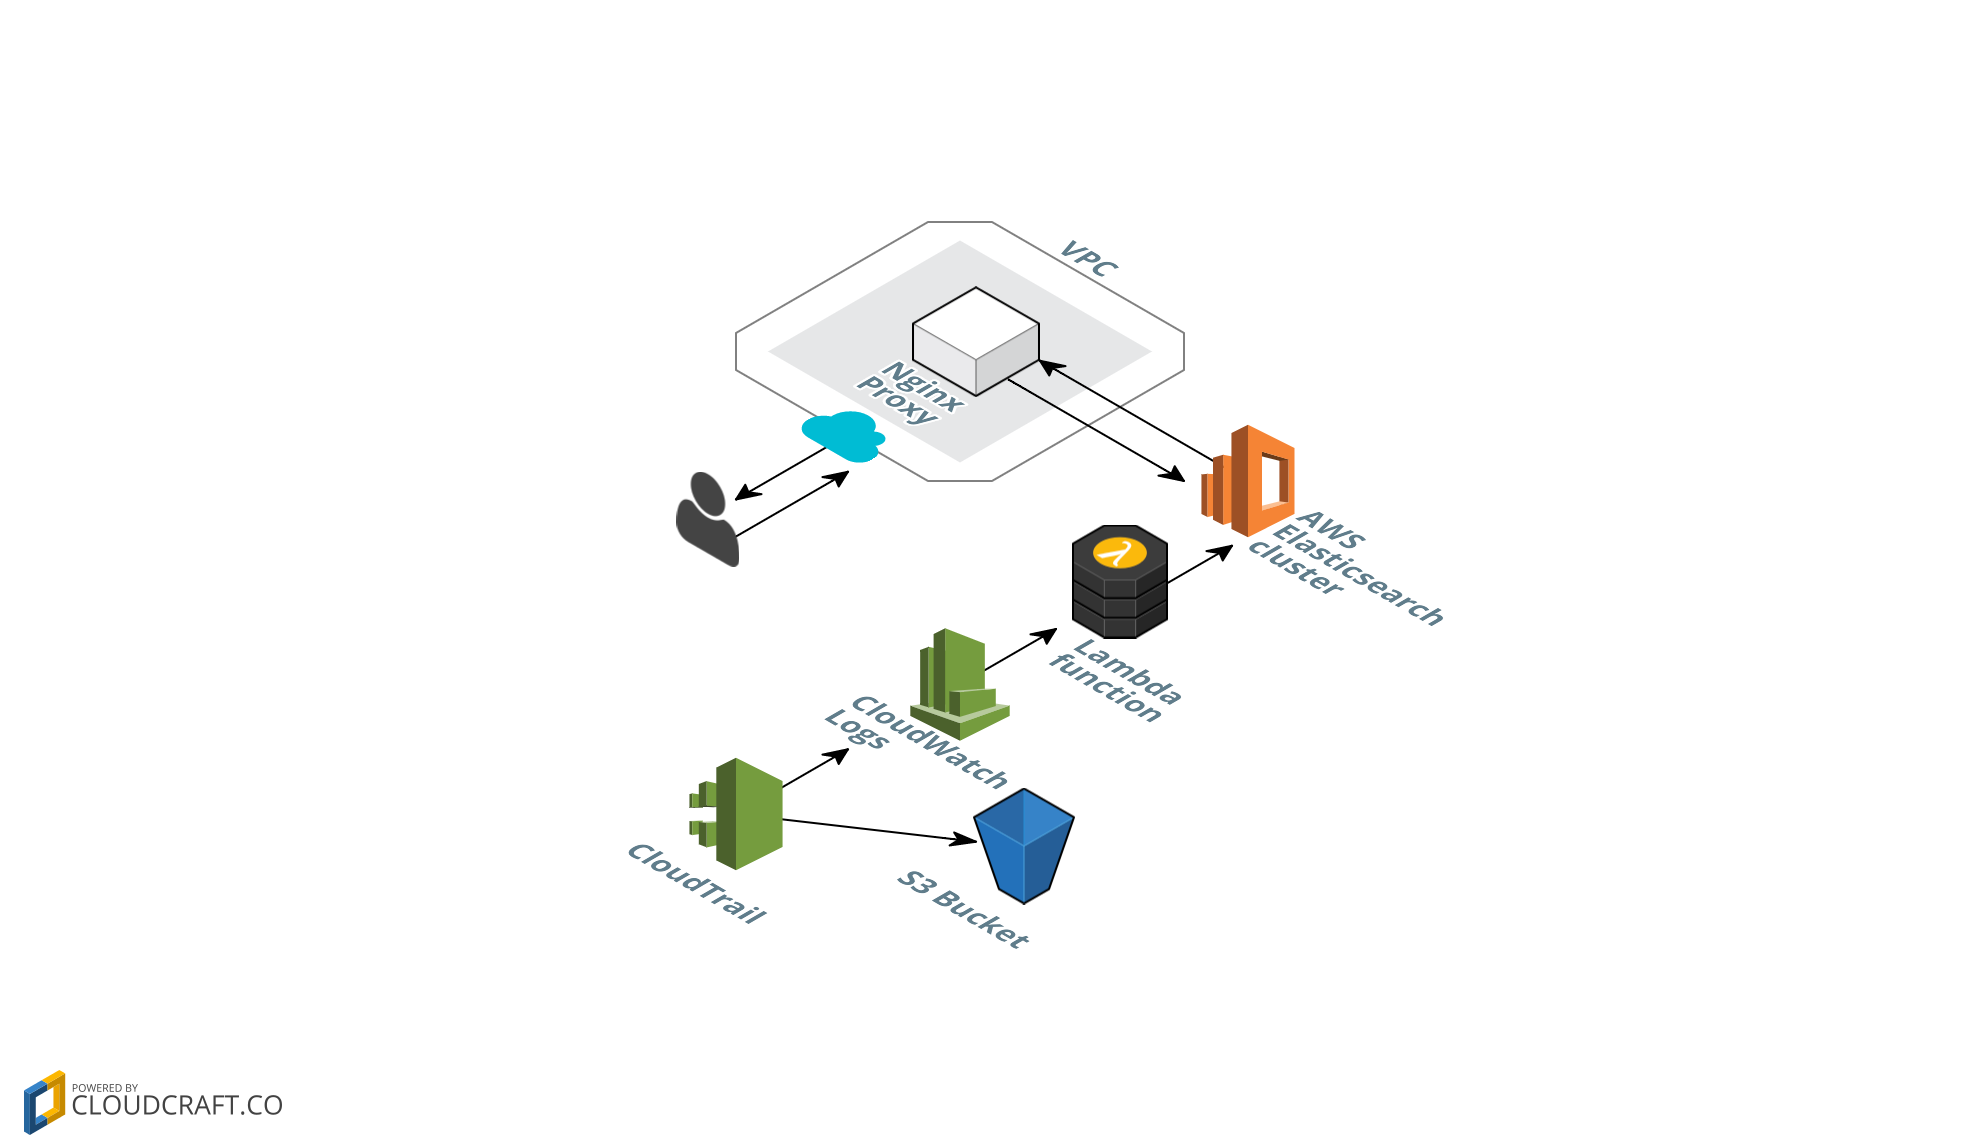
The CloudFormation template creates the following components:
- CloudTrail. Creates and activates a new trail with API activity. This trail is multi-region, meaning it captures activity from all AWS regions in your account.
- S3 Bucket. Stores CloudTrail data (required by CloudTrail)
- CloudWatch Log Group. CloudTrail also stores trail data here, before it is exported to Elasticsearch.
- CloudWatch Subscription Filter. Configures how CloudWatch Logs data is exported. In this case, to a Lambda function that writes data to Elasticsearch.
- AWS Lambda function. Receives events and trail data from CloudWatch Logs and forwards this data to Elasticsearch.
- AWS Elasticsearch cluster. Stores trail data in searchable format. Saves visualizations and dashboards that we access via Kibana.
- Nginx reverse proxy. The AWS Elasticsearch cluster is configured so it only accepts traffic from this proxy’s IP address. This proxy is deployed in your VPC - therefore you have the option to connect private EC2 instances to the Elasticsearch cluster, through this proxy server. Also, having this proxy makes it easier to update the allowed IP addresses that can access your Elasticsearch cluster. Making such a change in Elasticsearch takes several minutes, while updating your proxy’s Security Group takes effect immediately.
- IAM Roles. We create IAM roles that enable the different AWS services to execute operations on each other. For example, CloudTrail needs to put objects in an S3 bucket and create data in CloudWatch Logs. The Lambda function needs to write data to AWS ElasticSearch. All these permissions are defined in IAM roles that this CloudFormation template creates automatically.
Here is the CloudFormation link - clicking on it will take you to the AWS CloudFormation console, where you can start the creation of this auditing stack right now:

This link takes you to the AWS CloudFormation console and preselects the template, so you only have to click “Next”. Something like this:
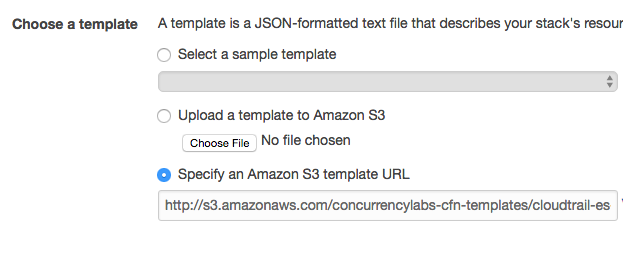
Clicking “Next” takes you to the following screen, where you specify additional details:
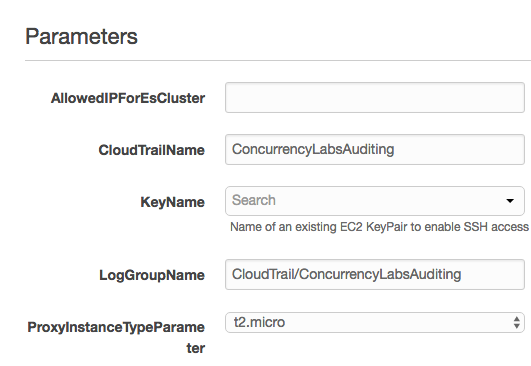
- Name of the stack
- AllowedIPForEsCluster. This is one IP address that has access to the Nginx proxy and therefore the Elasticsearch cluster. You could set this value to your computer’s IP. You can update this value by changing the EC2 Security Group of the Nginx proxy and add more IPs, or CIDR blocks. The changes will take effect immediately after you update the security group.
- CloudTrailName. Name of the trail
- KeyName. An existing EC2 key. If you don’t have one, you’ll have to create it in the EC2 console and return to this step.
- LogGroupName. The CloudWatch log group.
- ProxyInstanceTypeParameter. Instance type for the Nginx proxy. I selected a t2.micro by default, but you can choose any instance type from the drop-down.
Start the stack creation. You can check the progress in the CloudFormation console:
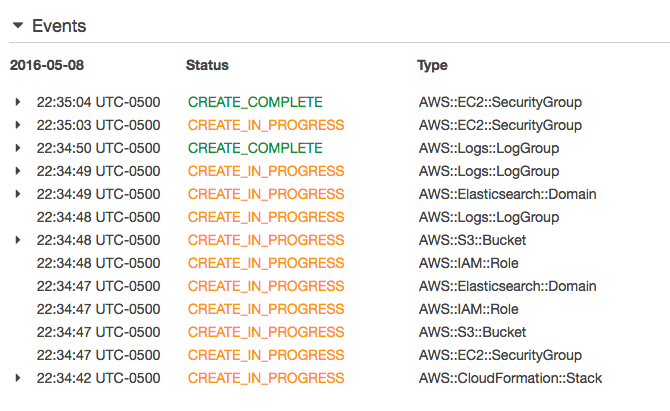
Wait a few minutes until the stack is created successfully (between 10 and 15 minutes). In the Outputs tab you can see the IDs of the AWS resources that have been created, including the URLs to access ElasticSearch.
Note that after the stack has been created, you have to wait an additional 5-10 minutes for the Elasticsearch cluster to be Active. If you try to access the cluster before its status is Active you will get an error.
Updating whitelisted IPs
You will eventually need to update the list of whitelisted IPs that can access your Elasticsearch cluster. You do this by updating the Security Group of the Nginx reverse proxy EC2 instance.
In the CloudFormation Outputs tab you will see the following key: NgninxProxySecurityGroupId. Use the value assigned to this key and search for it in the EC2 console, in the Security Groups section. Then add an Inbound rule for port 80:
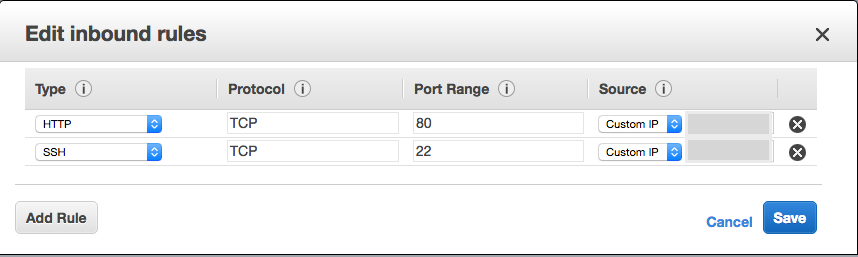
You can add as many entries as you need. If you are adding a single IP, note that you have to specify it in CIDR block notation, like this: “xxx.xxx.xxx.xxx/32” . The “/32” means there is only 1 matching IP. You can of course configure a wider CIDR block if you need to.
Configuring Kibana
As of today, AWS Elasticsearch only runs Kibana 4, which does not support importing dashboards, so we’ll have to create Kibana dashboards manually.
In the CloudFormation Outputs tab you will see the following key: KibanaProxyEndpoint. This link has the format http://{Nginx-Proxy-IP}/_plugin/kibana/ (don’t forget to include the “/” at the end!) The link will take you to the Kibana GUI landing page. If you can’t access it, make sure your IP is whitelisted in the EC2 Security Group (see section above).
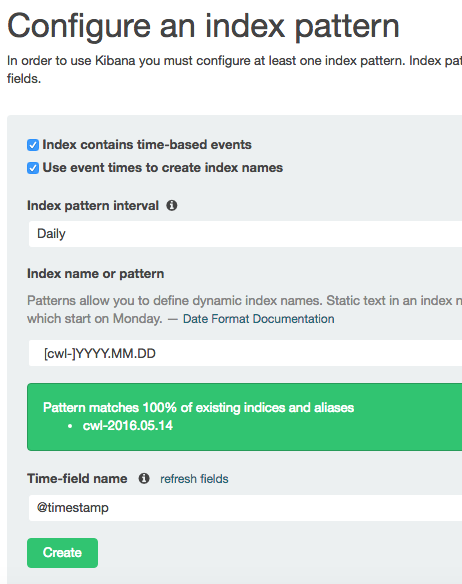
Once you land in Kibana, make sure you are in the “Settings” -> “Indices” view and configure the following values:
- Check “Index contains time-based events”
- Check “Use event times to create index names”
- Index pattern interval: Daily
- Index name of pattern: [cwl-]YYYY.MM.DD
- Time-field name: @timestamp
Now you can start creating Visualizations and Dashboards.
Make sure the time range in the top right corner is not “15 minutes”, otherwise you will get very limited or no data!

I recommend trying a longer range such as 2 weeks.
Visualizations and Dashboards
The first step in order to have a nice dashboard with a lot of graphs is to create individual visualizations. Each graph in a dashboard is a visualization. I recommend taking a look at tutorials on how to create visualizations in Kibana - there are many good ones out there such as this one.
Also, take a look at the relevant CloudTrail fields you might want to visualize: eventTime, eventVersion, userIdentity, eventSource, eventName, awsRegion, sourceIPAddress, userAgent, errorCode, errorMessage, requestParameters, responseElements, requestID, eventID, eventType, apiVersion, recipientAccountID, sharedEventID,
GitHub repo
I also created a code repository in GitHub, where you can see the CloudFormation template as well as the code of the Lambda functions.
To summarize
- When you work with external tools or service providers, it is highly recommended that you use CloudTrail to keep track of the operations they perform in your AWS account.
- I like transparency - that’s the reason I ask my clients to set up CloudTrail before I start any work on their AWS account.
- Building the infrastructure for CloudTrail data visualization using Elasticsearch is not trivial,
which is the reason I automated this process using CloudFormation. This way the whole setup can be completed
in a few clicks.
- There are examples on the internet that configure a similar architecture using self-managed EC2 instances. I chose to use the AWS Elasticsearch service, so I could have a fully managed Elasticsearch cluster and not have to worry about maintaining it myself.
- My setup consists of CloudTrail sending audit data to CloudWatch Logs, which has a Subscription Filter configured that forwards this data to a Lambda function. The Lambda function then writes incoming CloudTrail data to an AWS Elasticsearch cluster. Once the data is in AWS Elasticsearch, we use Kibana to save searches, graphs and dashboards. The Elasticsearch cluster is accessed through an Nginx reverse proxy that lives in EC2. You can configure access to this proxy using its EC2 security group. The proxy gives you access to the Elasticsearch cluster within your VPC.
I hope you find this useful!