
You’re executing load tests using Locust. Wouldn’t it be nice to have your test results in a single dashboard, together with system metrics such as CPU Usage, memory, Disk I/O, etc? How about integrating your test results with Continuous Integration pipelines? In this article I show you how to export your Locust load test results in real time, to CloudWatch Logs and CloudWatch Metrics.
Why is this relevant?
Load tests are essential
Executing load tests is an often overlooked, but essential part of running reliable applications. You want to know how your systems behave under high transaction volume BEFORE they handle real customer transactions. Without load tests, you’re one step closer to having a successful product launch ruined by outages or slow page loads.
Thankfully, there are many open source load test tools out there, such as JMeter and Locust. Also, thanks to the cloud, it’s very easy to launch performance test environments, execute tests and then terminate those environments. With the right automation in place, you can spin up a production-like environment in minutes.
However, simply executing load tests is not enough. You still need to analyze test results and ideally integrate test results with other systems, such as Continuous Integration workflows.
A bit about Locust
Locust is a popular open source load testing tool that allows you to create test scenarios by writing Python code. One key difference compared to JMeter is that you don’t need to create XML files or install plug-ins. With Locust you can use any Python library, create your own Python modules and use them in your performance tests. Since tests are written as code, you can model complex user behavior relatively easily.
The problem
Since AWS system metrics and test result metrics live in different places, it’s difficult to correlate how a test metric affects your systems and customer experience. This situation consumes a lot of time when doing test result analysis. It also makes it more likely to miss critical cause-and-effect situations that could put your customer experience at risk in production.
For example: what was the CPU Utilization when P90 response time started to exceed 1000ms? What was the number of users when Memory exceeded 75%? How much data transfer out should I expect at 1,000 concurrent users (so I can calculate cost accurately)? The list goes on and on.
The other problem is that without proper test results integration, you won’t have a way to automate your load tests with a Continuous Integration pipeline. You would have to analyze test results and then manually click a button. This can be a pain over time.
The solution
The most obvious solution is to have all metrics in a single place and ready to be integrated with other systems. CloudWatch is a perfect tool for that. So that’s what we’ll do. I wrote a Python module that exports test results from Locust to CloudWatch Logs and CloudWatch Metrics, in real time.
This is the architecture:
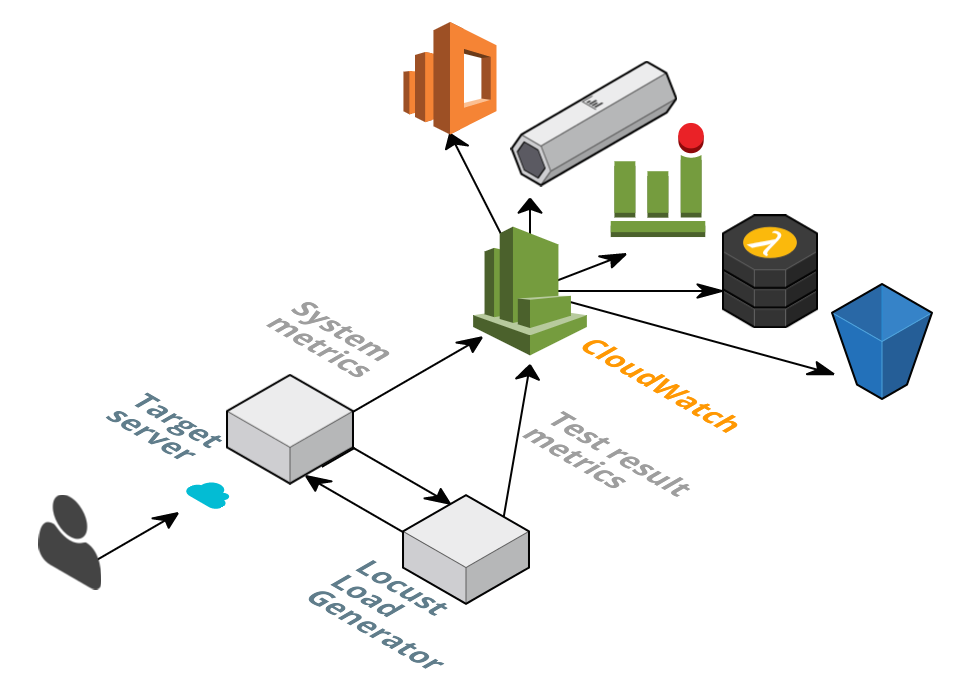
Once metrics arrive to CloudWatch, they can trigger alarms, which trigger SNS notifications. Since this module also writes test results to CloudWatch Logs, you can configure subscriptions that integrate with Lambda functions, Kinesis streams, AWS Elasticsearch or that simply store results in S3.
Having this setup has the following advantages:
- You can build a CloudWatch Dashboard for easy visualization. This will save you a lot of time when doing manual test result analysis, troubleshooting and system tuning.
- Exporting results to Kinesis, Elasticsearch, SQS or Lambda functions can be used to do more sophisticated analysis.
- You can automatically store test results in S3 and keep an archive of your system performance over time.
- You can integrate test results with Continuous Integration pipelines - either external ones or AWS built-in, such as Code Pipeline.
- You can integrate test results with any HTTP endpoint, including Slack Bots or pretty much any tool with an API.
Let’s see it in action…
I created a CloudFormation template that launches an EC2 instance, installs Locust, assigns permissions using an EC2 Instance Profile and downloads the necessary files:

I created a GitHub repo, where you can see more details and instructions on how to use it:
See the Locust/CloudWatch connector in GitHub
For this demonstration, I launched a simple WordPress site consisting of one t2.micro instance and preloaded with 500 posts. This is the server we will load test. I also created a CloudWatch Dashboard where I can see Locust and EC2 metrics.
The custom Python module I wrote responds to request success and request failure events (among others) and publishes data to CloudWatch Metrics and CloudWatch Logs.
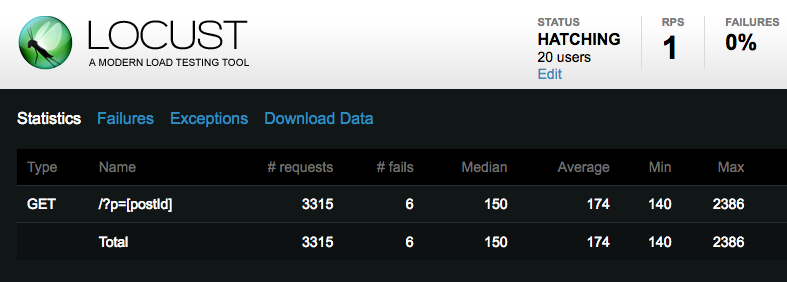
This is what I typically see in a Locust dashboard. I like that it’s simple, but as you can see, it doesn’t tell me much. I could download a .csv file with percentile distributions, but it’s a summary of values for the whole duration of the test. Again, it’s hard to correlate system behaviour with test results (or viceversa).
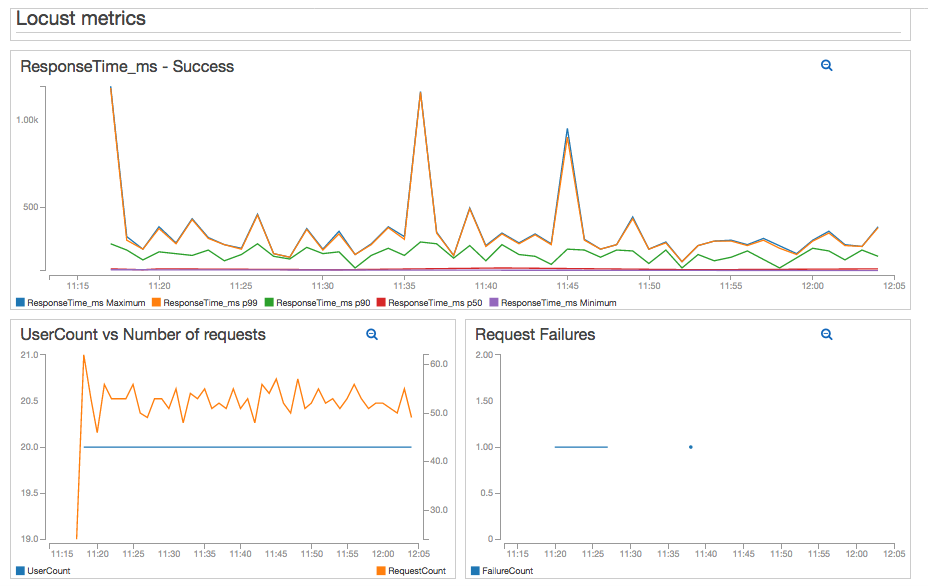
The Python module I wrote publishes the following metrics:
- ResponseTime_ms. Response time in milliseconds. This metric is reported each time there is a successful response.
- FailureCount. Every time a request fails, a metric record is created in CloudWatch.
- RequestCount. Request count, regardless of response status.
- UserCount. Number of users “hatched” by Locust.
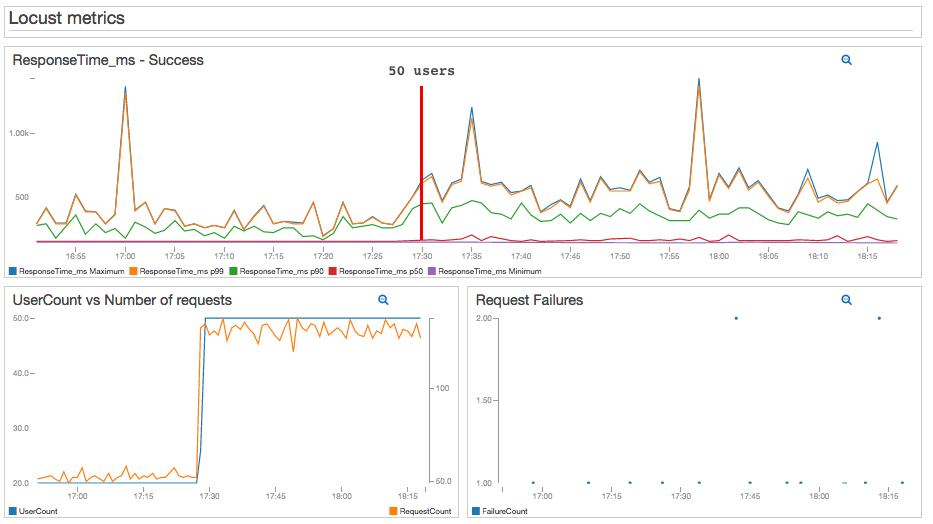
Thanks to the CloudWatch Percentile Statistics feature, I can now see the response time distribution in my test results. Since I have a CloudWatch Dashboard, I can see in a single place how the number of users and requests affect response times. I can also see failures.
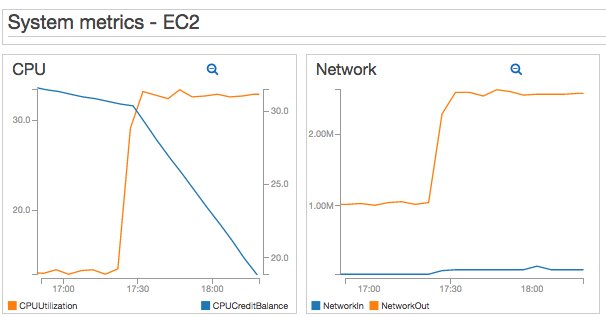
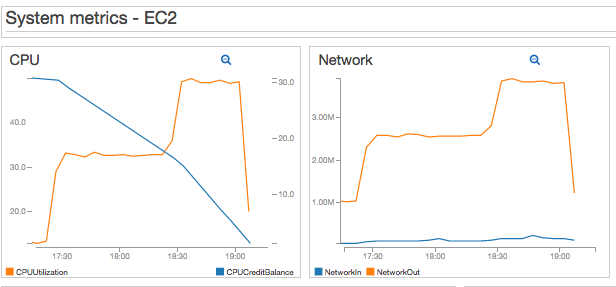
In the same dashboard, I included some EC2 metrics, which you can see below:
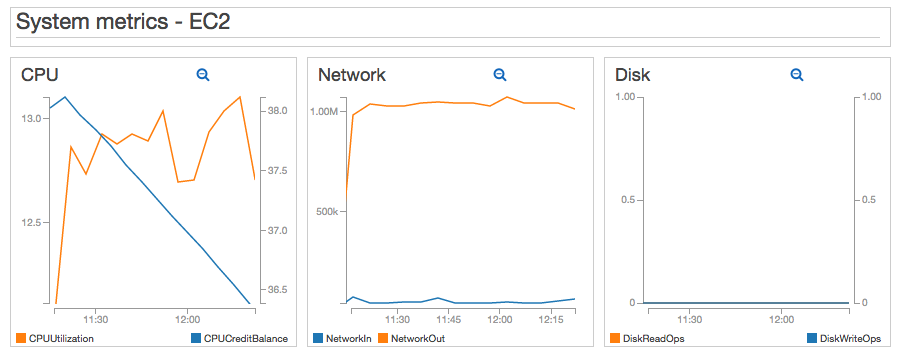
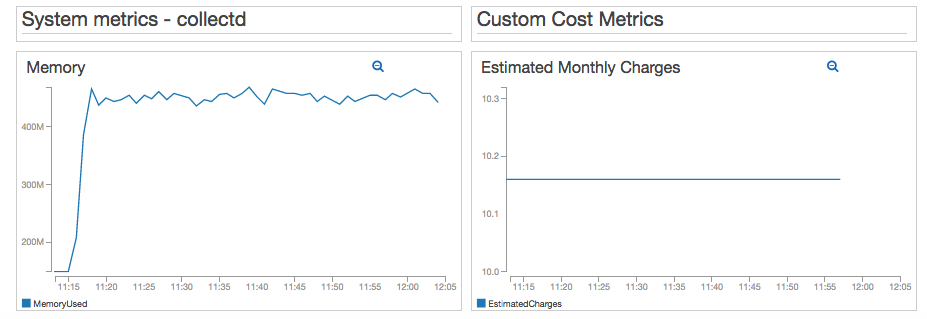
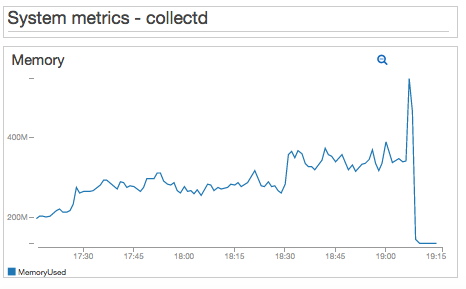
As a bonus, I installed the collectd CloudWatch plugin in the WordPress EC2 instance. For this test I am including Memory metrics, which are not published natively by EC2. Using the collectd agent you could include dozens of other metrics, in addition to Memory. I also included the EstimatedCharges metric that I calculate using my Near Real-time Lambda function. Since we’re only using a t2.micro, the estimated monthly EC2 charges will remain constant.
Now I have a good way of visualizing Locust load test metrics, together with collectd, AWS built-in and custom metrics!
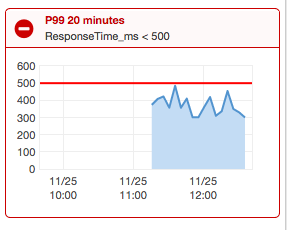
I can also set up a CloudWatch Alarm that automatically sends a notification to my team or an external system. I could use any criteria, but for illustration purposes let’s say the test is considered successful when ResponseTime P99 < 500ms for 20 minutes:
If I increase the number of users, I will see the effects in my dashboard right away. In this test, I increased the number of concurrent users from 20 to 50. The P99 and Max ResponseTime increased noticeably. The P90 statistic increased slightly, but still remained below 500ms.
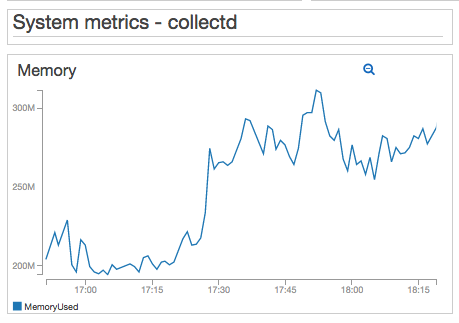
I can see the effects in my EC2 and collectd metrics as well:
Now, just for fun, I increased the number of users to 75 - which I knew it would break my t2.micro WordPress server eventually. So this is what server failure looks like in my dashboard:
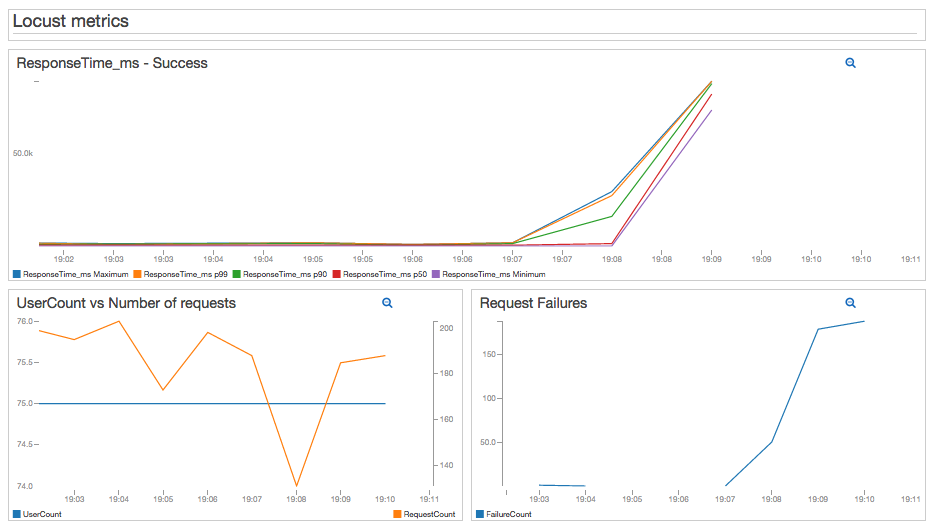
I won’t get into system tuning details, but the important thing here is that I can quickly connect test result failure with system metrics. This will help a lot during troubleshooting and tuning.
I’ve been using this code already for some load tests of my own and I’m very happy with the results. It has saved me a lot of time and improved my productivity. I hope it does the same for you!
Where to go from here
- The CloudFormation template creates a Security Group that is open for port 8089 (the port used by the Locust web interface). I strongly recommend you restrict access to this port based on your workstation’s IP, or your VPN.
- CloudWatch Alarms are very handy when executing Sustainment Tests. These tests generate high load for an extended period of time and validate the system against issues that take hours or even days to manifest (i.e. memory leaks). Since I’m sure you don’t want to be glued to your computer for several days, getting alarm notifications will make your life much easier.
- You now have a CloudFormation template and metrics that can trigger alarms. Therefore you can run these tests automatically as part of Continuous Integration/Delivery/Deployment pipelines and send notifications when tests pass or fail. You can also send test results to Slack bots or other tools.
- You might find it useful to use the Elastic Container Service to launch Locust load generators. That could be material for a future article, but you could create a Locust Docker image and launch your tests that way.
- If you’re interested in JMeter instead, I also wrote an article where I describe a method to export JMeter metrics to CloudWatch.
Are you launching soon or want to make sure your products don’t crash?
I can certainly help you with planning, designing, executing and fine-tuning load scenarios for your application. Just click on the Schedule Consultation button below and I’ll be glad to have a chat!