Data Streaming has become an essential component in many modern applications. It enables the continuous and immediate collection and processing of incoming data from multiple sources. It also enables applications to take immediate action when specific patterns are encountered and it allows data to be stored in a consistent format where it can be accessed by data analytics platforms in near real-time.
There is a very wide range of use cases for Data Streaming, from live monitoring of business processes and operational metrics, to product recommendations or fraud detection, and multiple scenarios for specific business needs. AI applications can use it for model training, optimizations, inference and Retrieval-Augmented Generation (RAG) tasks - using Data Streaming solutions that process real-time data sent to Apache Kafka components.
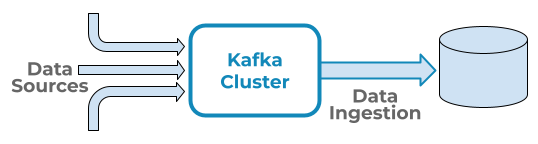
Apache Kafka is an essential platform in Data Streaming because it works as the central system that receives ongoing data from multiple sources and immediately makes it available to Data Ingestion platforms, which process this incoming data and make it ready for analysis and further actions. The diagram below displays the data flow in this type of implementation at a high level:
This article includes benchmark results for data ingestion platforms AWS Data Firehose, Confluent Tableflow and Starburst Galaxy, ingesting and processing data from an Apache Kafka cluster and storing it in a destination table using Iceberg format. These platforms provide a serverless approach that simplifies the launch of data ingestion processes that connect to a Kafka cluster, in a secure way, using authentication mechanisms. The Iceberg table format delivers multiple benefits in terms of data management and performance and it has become an essential component when implementing Data Lakehouse architectures.
Kafka clusters for these tests were deployed using AWS MSK (Managed Streaming for Apache Kafka) and Confluent Cloud. Both services manage the provisioning of compute infrastructure and Kafka functionality, simplifying the operational launch and maintenance of Apache Kafka infrastructure.
Test Scenarios
The tests in this article include the following four scenarios:
Amazon MSK Kafta cluster:
- Data Ingested by AWS Data Firehose
- Data ingested by Starburst Data Ingest.
Confluent Cloud Kafka cluster:
- Data ingested by Confluent Tableflow
- Data ingested by Starburst Data Ingest.
| Scenario | Cluster | Data Ingestion |
| 1 | Amazon MSK | AWS Data Firehose |
| 2 | Amazon MSK | Starburst Data Ingest |
| 3 | Confluent Cloud | Confluent Tableflow |
| 4 | Confluent Cloud | Starburst Data Ingest |
The data used for these tests corresponds to a single table from the standard TPC-DS benchmark, store_sales. Data for this table is from the 10GB (sf10) TPC-DS dataset and records were converted to JSON format prior to being sent to the Kafka cluster. Data size in JSON format was 14GB and contained 28.8 million records. All tests were executed using exactly the same source data, in the AWS N. Virginia region.
Data was sent to the Kafka cluster using Python data producer libraries. After all data was sent to the Kafka cluster, it was then ingested and converted to Iceberg table format with S3 as a storage destination, accessed through an AWS Glue catalog.
Test Execution Steps
The following steps were executed consistently in each test scenario:
- Kafka Cluster launch
- Launch a Kafka cluster, according to the test scenario (Amazon MSK or Confluent Cloud).
- Produce Data
- Execute Kafka Data Producer scripts to send JSON records to the relevant Kafka Cluster. All tests use the same set of JSON records.
- Data Producer scripts are implemented in Python. For MSK, using the
KafkaProducerPython library, as per MSK documentation. For Confluent Cloud, using theconfluent_kafkaPython library, which is included in the Confluent platform documentation. - All Data Producer scripts were executed from an EC2 m5.8xlarge instance.
- Records were sent to a single Kafka topic.
- Launch Data Ingestion
- Once all JSON records have been sent to the Kafka cluster, configure and launch the relevant Data Ingestion platform according to the test scenario (e.g. AWS Data Firehose, Confluent Tableflow or Starburst Data Ingest).
- Ingest data from the Kafka topic used by the data producer task.
- Data ingestion configurations include a separate schema per test scenario, to ensure a unique
store_salesdestination table is created in each test.
- Monitor and collect metrics
- Review data ingestion metrics, according to the Kafka cluster and data ingestion platform.
- Once metrics indicate data ingestion has concluded, execute queries on the Iceberg table created by the data ingestion platform, to validate all data was ingested properly.
Infrastructure Setup
Required infrastructure was launched using CloudFormation for AWS resources and the Starburst Galaxy and Confluent Cloud GUI for other components. All platforms were configured to launch resources on Amazon Web Services in the N. Virginia AWS region (us-east-1) and were granted cross-account permissions (IAM Roles) to access resources in the AWS account managed by Concurrency Labs. All platforms accessed the AWS Glue catalog in the Concurrency Labs AWS account and used an Iceberg table as the final destination.
Amazon MSK Cluster:
- Managed Streaming for Apache Kafka
- 10 kafka.m5.4xlarge nodes.
- Partitions per topic: 1,000 (100 per broker node)
- Kafka version: 3.8.x (recommended version in the AWS documentation at the time of launch)
- MSK provisioned Clusters took approximately 60-90 minutes to launch and be ready for testing, compared to Confluent Clusters that are available within seconds, as expected in a serverless platform.
Amazon Data Firehose:
- Destination: Apache Iceberg Table in Glue catalog.
Confluent Cloud:
- Cloud provider: AWS - N. Virginia
- Cluster type: Standard
- Partitions per topic: 1,000
- Auto Scaling enabled for up to 10 eCKUs (compute capacity unit assigned to Confluent clusters). eCKU equivalency in vCPU, Networking or Memory units is not available in the Confluent documentation.
Confluent Tableflow:
- Cloud provider: AWS - N. Virginia
- Destination: Apache Iceberg Table in Glue catalog.
Starburst Galaxy Data Ingestion:
- Cloud provider: AWS - N. Virginia
- Starburst creates a raw table as the initial destination for the data ingestion and a transform table, which uses the raw table as its data source and it becomes the final Iceberg destination for the ingested data.
- Catalog: AWS Glue
- Source for raw table: AWS MSK or Confluent Cloud, depending on the test scenario.
- Throughput limit per partition: 1MB/s (1GB/s in total, considering there are 1,000 partitions per topic). This configuration does not support auto-scaling and it is recommended to regularly monitor ingestion rates in order to adjust it and optimize cost. Starburst supports up to 100GB/s for data ingestion throughput.
Both AWS Data Firehose and Confluent Tableflow deliver an approach that does not support the configuration of the data ingestion throughput capacity. Unlike Starburst Galaxy, which requires the configuration of a throughput limit per topic partition.
Relevant Metrics
Each platform has its own set of metrics, which were used to measure performance in the data ingestion cycle. All metrics have a 1-minute granularity.
Amazon MSK Cluster:
Metrics are available in AWS CloudWatch.
BytesInPerSec. The number of bytes per second received from the data producer in a particular broker node and topic.MessagesInPerSec. The number of incoming messages per second for each broker node.BytesOutPerSec. The number of bytes per second sent to data ingestion platforms (e.g. AWS Data Firehose or Starburst), available per broker node and topic.
AWS Data Firehose:
Metrics are available in AWS CloudWatch.
DataReadFromSource.Records. The number of records read from the source MSK Kafka Topic.DataReadFromSource.Bytes. The number of bytes read from the source MSK Kafka Topic.DeliveryToIceberg.IncomingRowCount. Number of records from MSK cluster that Firehose attempts to deliver to Apache Iceberg Tables.DeliveryToIceberg.SuccessfulRowCount. Number of successful rows delivered to Apache Iceberg Tables.DeliveryToIceberg.FailedRowCount. Number of failed rows. These records get delivered to an S3 backup bucket.DeliveryToIceberg.Bytes. The number of bytes delivered to Apache Iceberg Tables over the specified time period.
Confluent Cloud:
Metrics are available in Confluent Cloud at the cluster level and were extracted using the Confluent Cloud Metrics API.
received_bytes. Bytes produced into the cluster, grouped by topic.sent_bytes. Bytes consumed from the cluster, grouped by topic.received_records. Count of records received by the cluster from producers.sent_records. Number of records sent to data ingestion consumers.
Starburst Galaxy:
Partner connect was configured with Amazon CloudWatch. The following metrics were exported to CloudWatch:
StreamingIngest_UncompressedReceivedBytesTotal. Amount of data (in bytes) ingested into Starburst.StreamingIngest_RecordsLagMax. The maximum lag between the latest records processed and incoming ones.
Iceberg @snapshot Tables:
Iceberg @snapshot tables contain metadata related to data creation timestamps and data creation volume. They were queried in order to get relevant timestamps for record creation rates and data throughput.
Test Results
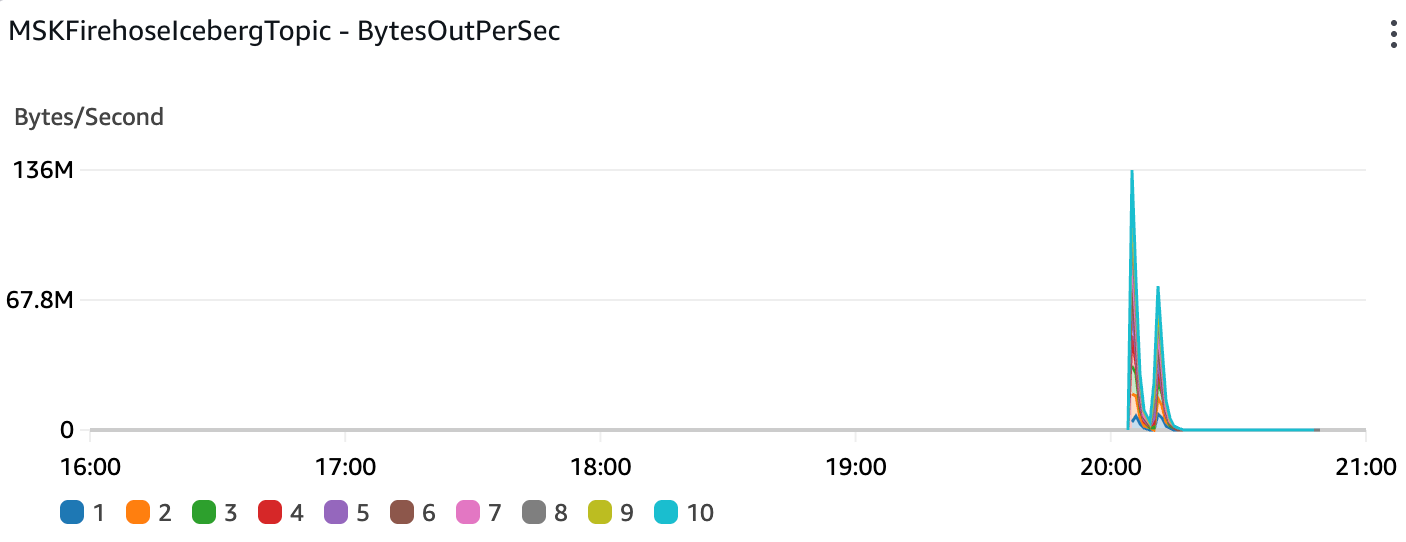
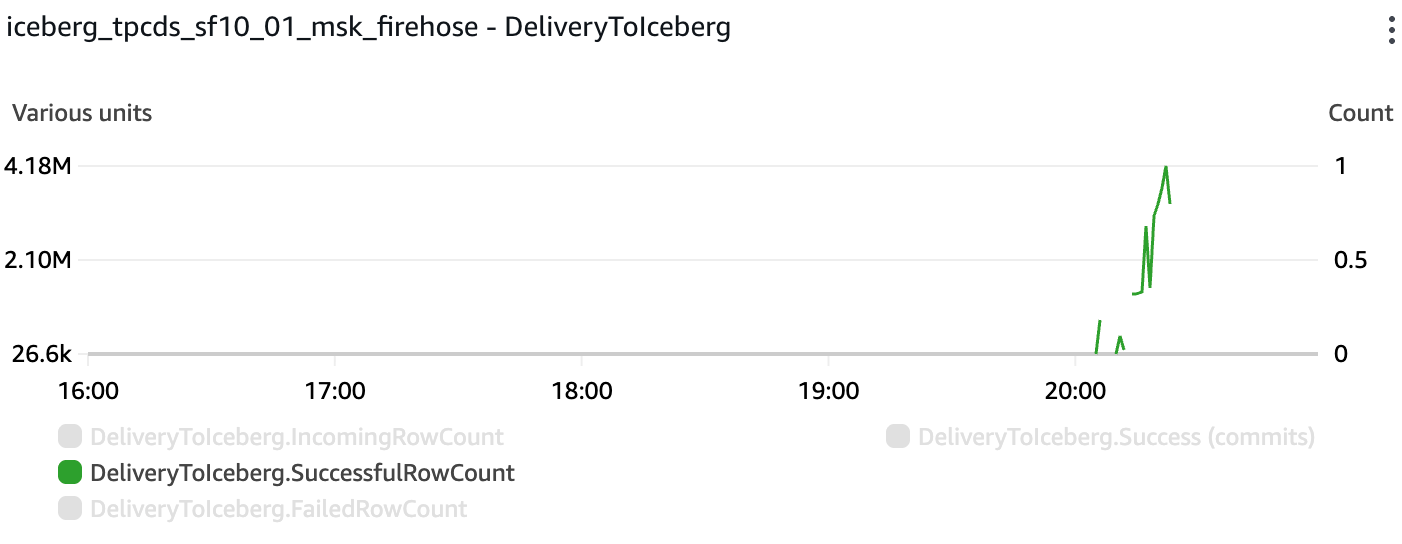
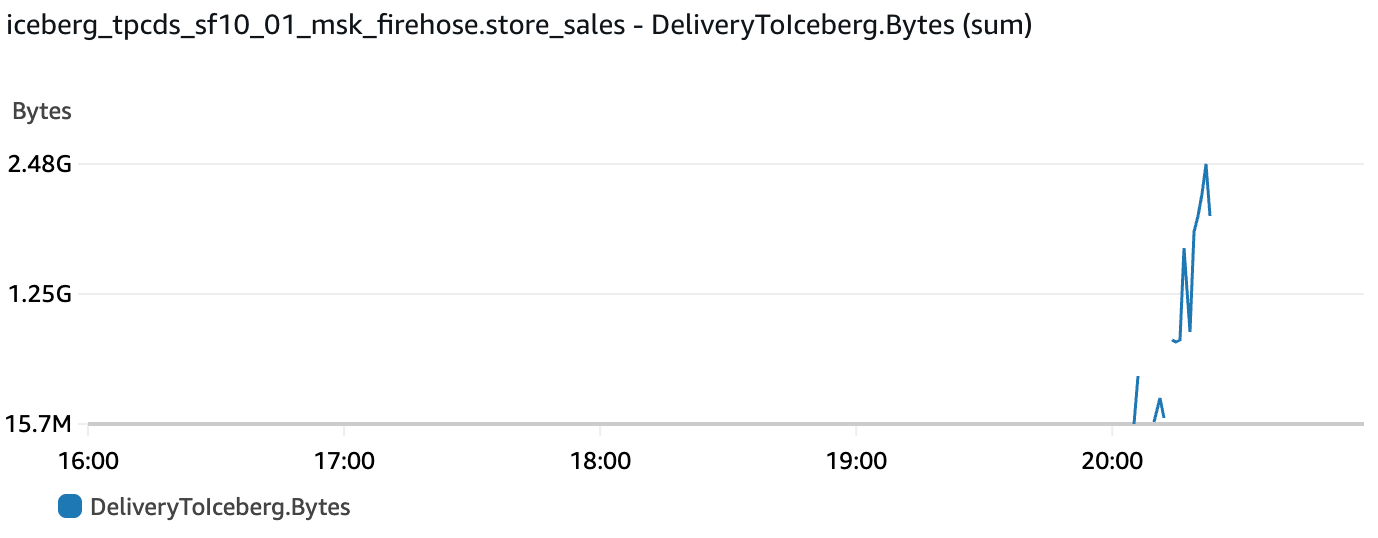
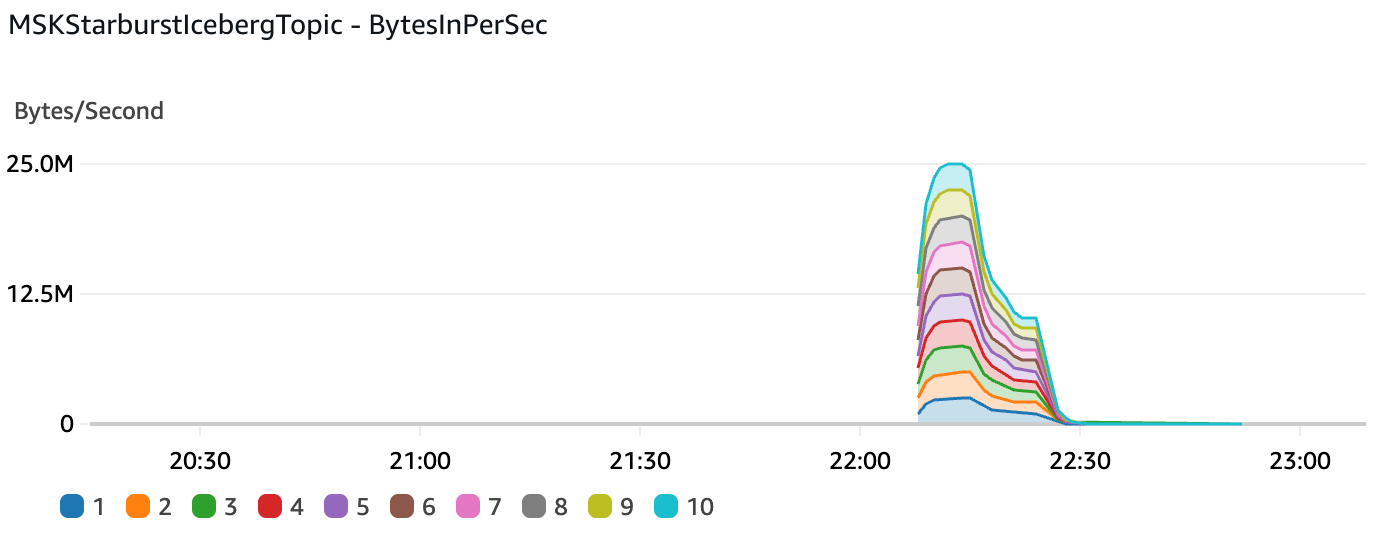
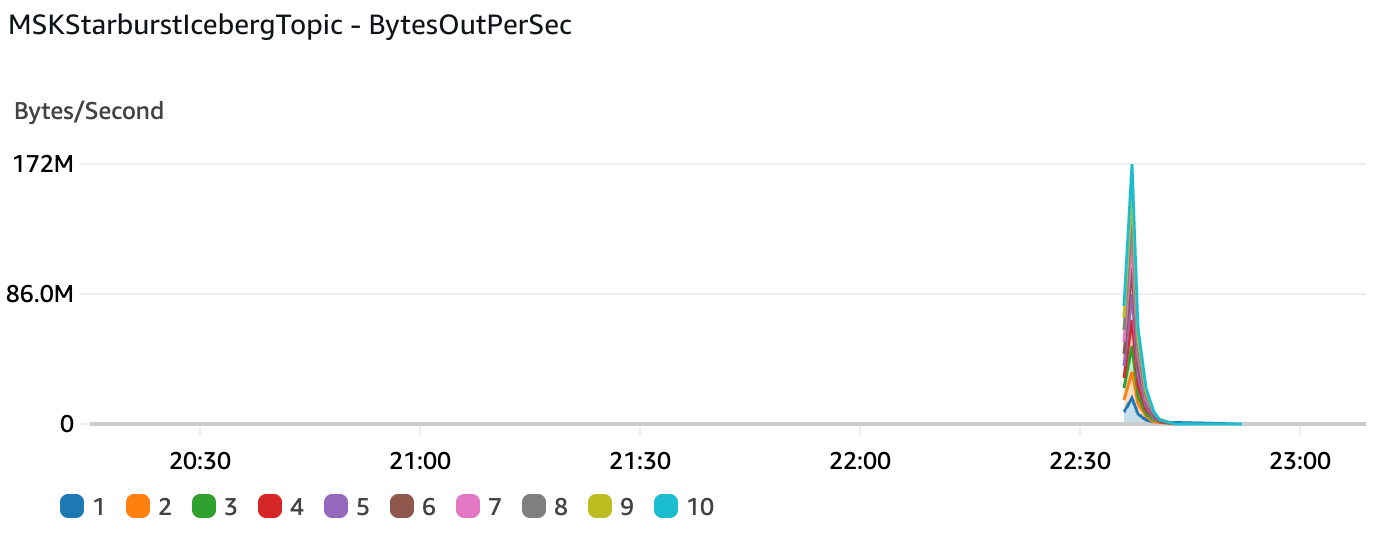
Data in Amazon MSK cluster ingested by AWS Data Firehose
Data Production into the MSK cluster reached a peak of 25.4 MB/s.
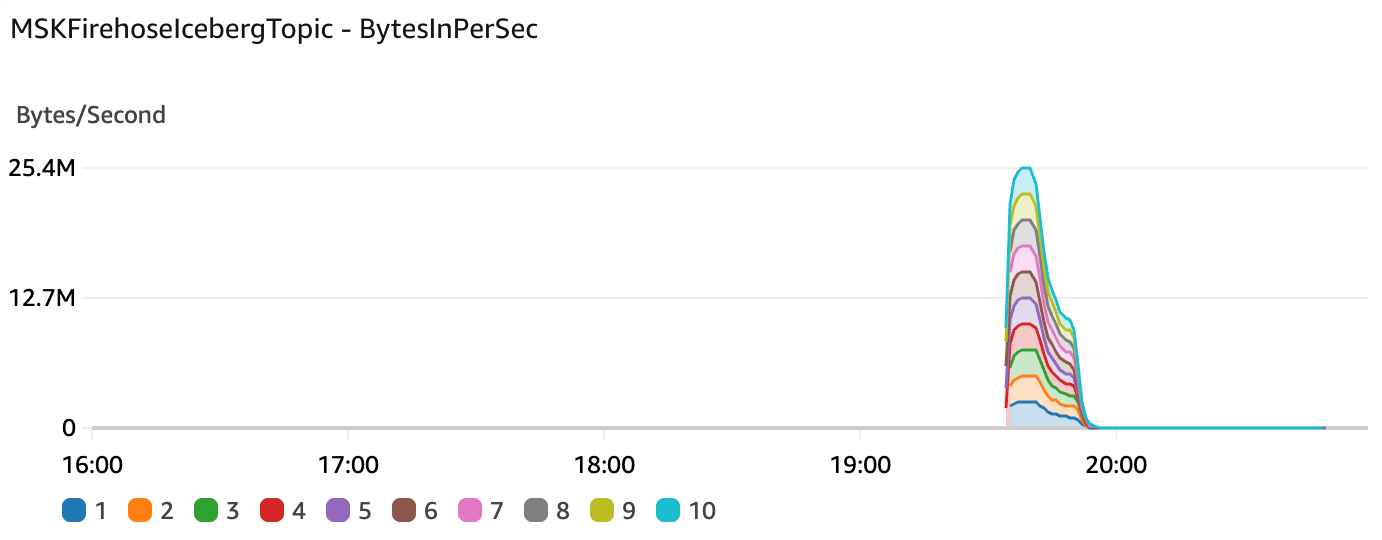
Data throughput out of the MSK cluster (into the Data Firehose stream) reached a peak of 136MB/s:
All rows were successfully delivered into the target Iceberg table. The maximum rate was 4.18M records per minute:
Bytes delivered to the Iceberg table reached a peak of 2.48GB in one minute:
S3 storage: 15.2 GB (9% higher than initial 14GB of JSON data sent to MSK)
Iceberg @snapshots table summary:
- Seconds taken to ingest all records into Iceberg table: 1,082
- Average records per second: 26,594 records/s
- Average data conversion rate into Iceberg format: 15MB/s
Latency between initial cluster BytesOutPerSec metric timestamp and Iceberg table completion: 1,202 seconds
Data in Amazon MSK cluster ingested by Starburst Galaxy
Data Production into the MSK cluster reached a peak of 25 MB/s.
Data throughput out of the MSK cluster (into Starburst) reached a peak of 172MB/s:
S3 storage: 1.9 GB (86% compression compared to initial 14GB of JSON data sent to MSK).
Iceberg @snapshots table summary:
- Seconds taken to ingest all records into Iceberg tables:
- raw table: 145
- transform table: 153
- Average ingested records per second:
- raw table: 198,628 records/s
- transform table: 188,242 records/s
- Average data conversion rate into Iceberg format:
- raw table: 24.1 MB/s
- transform table: 13.7 MB/s
Latency between initial cluster BytesOutPerSec metric timestamp and Iceberg table completion: 190 seconds
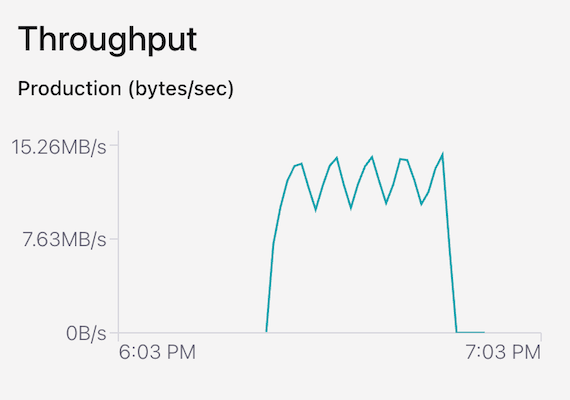
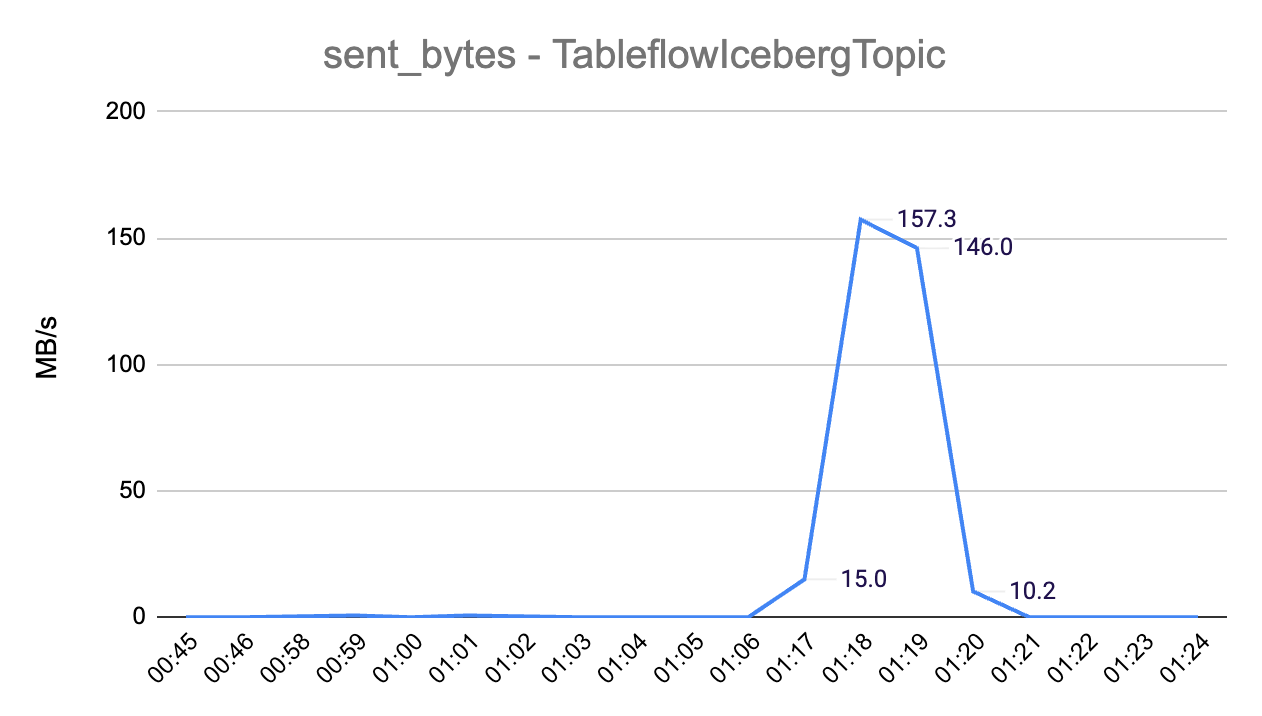
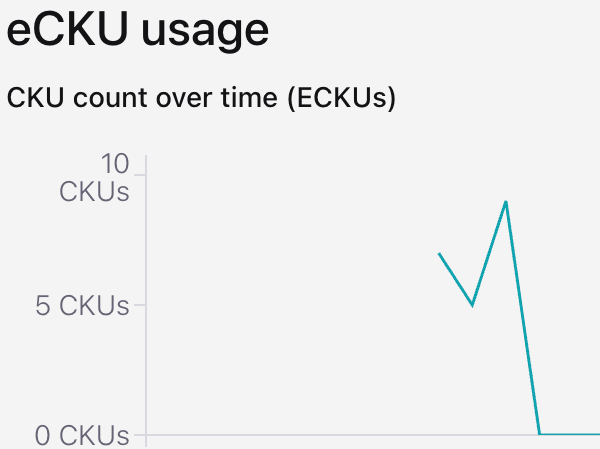
Data in Confluent Cloud cluster ingested by Confluent Tableflow
Data Production into the Confluent Cloud cluster reached a peak of 15.26 MB/s.
Data throughput out of the Confluent Cloud cluster (into Tableflow) reached a peak of 157.3MB/s:
eCKU (Confluent Cloud compute capacity unit) reached a peak of 9 eCKUs:
S3 storage: 4.4 GB (69% compression compared to initial 14GB of JSON data sent to Confluent Cloud)
Iceberg @snapshots table summary:
- Seconds taken to ingest all records into the target Iceberg table: 1020
- Average ingested records per second: 28,236 records/s
- Average data conversion rate into Iceberg format: 4.7 MB/s
Latency between initial cluster sent_bytes metric timestamp and Iceberg table completion: 1,108 seconds.
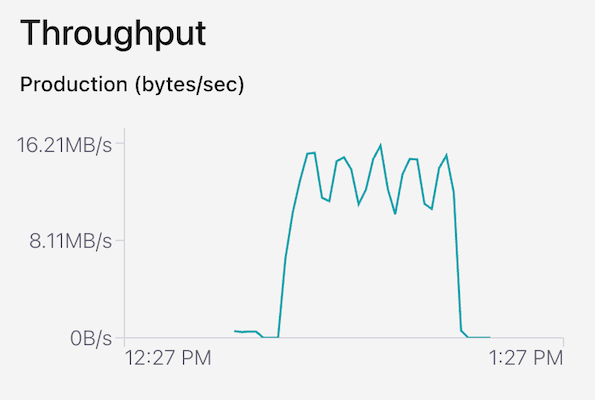
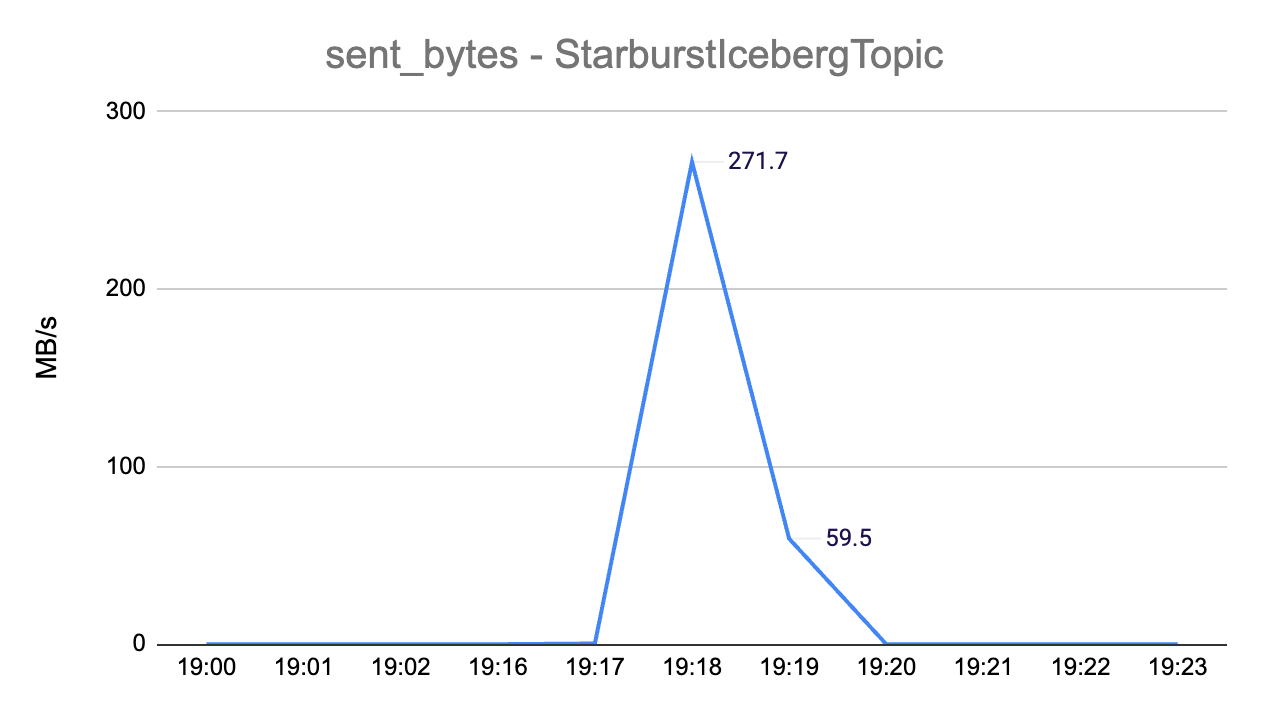
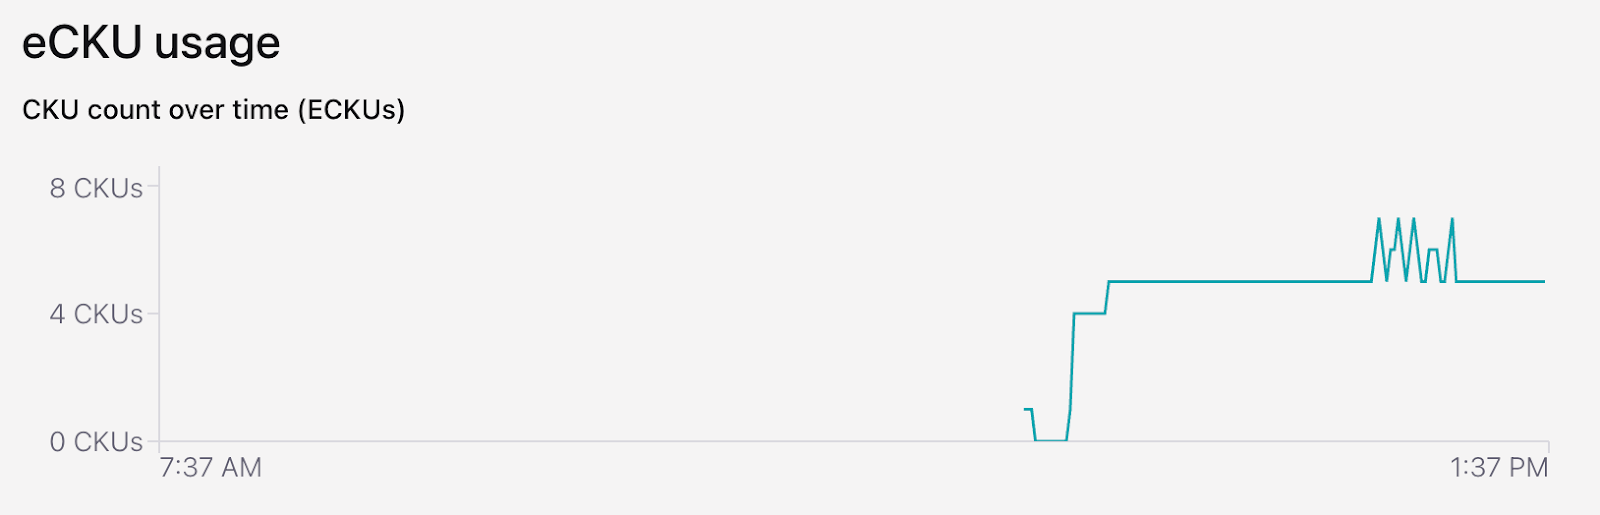
Data in Confluent Cloud cluster ingested by Starburst Galaxy
Data Production into the Confluent Cloud cluster reached a peak of 16.2 MB/s.
Data throughput out of the Confluent Cloud cluster (into Starburst) reached a peak of 271.7MB/s:
eCKU (Confluent Cloud compute capacity unit) remained at 5 eCKUs most of the time and it reached a peak of 7 eCKUs:
S3 storage: 1.9 GB (86% compression compared to initial 14TB JSON data sent to Confluent Cloud)
Iceberg @snapshots table summary:
- Seconds taken to ingest all records into Iceberg tables:
- raw table: 146
- transform table: 144
- Average ingested records per second:
- raw table: 197,267 records/s
- transform table: 200,007 records/s
- Average data conversion rate into Iceberg format:
- raw table: 23.9 MB/s
- transform table: 14.6 MB/s
Latency between initial cluster sent_bytes metric timestamp and Iceberg table completion: 178 seconds.
Performance Comparison
The following table compares data ingested by AWS Data Firehose and Starburst, from an AWS MSK cluster:
| Cluster type: AWS MSK | |||
| AWS Data Firehose | Starburst | Starburst vs. AWS Data Firehose | |
| Iceberg @snapshot table timestamps: seconds taken to ingest all records into target Iceberg table | 1082 seconds | 153 seconds | 0.14 |
| Iceberg @snapshot table: average records per second, ingested into Iceberg table | 26,594 rec/s | 188,242 rec/s | 7.1 |
| Iceberg @snapshot table: total file size for Iceberg table | 15.2 GB | 1.9 GB | 0.13 |
| Iceberg @snapshot table: average data ingestion rate into Iceberg format (MB/s) | 15 MB/s | 13.7 MB/s | 0.91 |
| Cluster metrics: maximum data ingestion rate from cluster (MB/s, 1-minute aggregation) | 136 MB/s | 172 MB/s | 1.26 |
The Starburst data ingestion rate (MB/s) into Iceberg format was 9% lower compared to Data Firehose, but the final Iceberg data size created by Data Firehose was 15.2GB vs. 1.9GB by Starburst (8x more data). Due to the more efficient data storage generated by Starburst, the total amount of time it took Starburst to ingest all data into Iceberg format and the records/second ingestion rate were 7.1x faster compared to Data Firehose.
The following table compares data ingested by Confluent Tableflow and Starburst, from a Confluent Cloud cluster:
| Cluster type: Confluent Cloud | |||
| Confluent Tableflow | Starburst | Starburst vs. Confluent Tableflow | |
| Iceberg @snapshot table timestamps: seconds taken to ingest all records into target Iceberg table | 1020 seconds | 144 seconds | 0.14 |
| Iceberg @snapshot table: average records per second, ingested into Iceberg table | 28,236 rec/s | 200,007 rec/s | 7.1 |
| Iceberg @snapshot table: total file size for Iceberg table | 4.4 GB | 1.9 GB | 0.43 |
| Iceberg @snapshot table: average data ingestion rate into Iceberg format (MB/s) | 4.7 MB/s | 14.6 MB/s | 3.11 |
| Cluster metrics: maximum data ingestion rate from cluster (MB/s, 1-minute aggregation) | 157.3 MB/s | 271.7 MB/s | 1.73 |
Starburst had a higher Iceberg record ingestion (records/sec) and higher data ingestion rate (MB/s) by 7.1x and 3.1x, respectively, compared to Confluent Tableflow.
The following table compares how Starburst performed when ingesting data from AWS MSK or a Confluent Cloud cluster:
| Starburst Data Ingestion | |||
| Source: AWS MSK Cluster | Source: Confluent Cluster | Starburst: Confluent vs. MSK | |
| Iceberg @snapshot table timestamps: seconds taken to ingest all records into target Iceberg table | 153 seconds | 144 seconds | 0.94 |
| Iceberg @snapshot table: average records per second, ingested into Iceberg table | 188,242 rec/s | 200,007 rec/s | 1.06 |
| Iceberg @snapshot table: total file size for Iceberg table | 1.9 GB | 1.9 GB | 1 |
| Iceberg @snapshot table: average data ingestion rate into Iceberg format (MB/s) | 13.7 MB/s | 14.6 MB/s | 1.07 |
| Cluster metrics: maximum data ingestion rate from cluster (MB/s, 1-minute aggregation) | 172 MB/s | 271.7 MB/s | 1.58 |
Starburst records per second and data ingestion rates were very similar when ingesting from either AWS MSK or Confluent Cloud.
Cost Analysis
Cost calculations assume non-stop data production and ingestion in a 1-month period and reflect data production and data ingestion metrics observed in the test executions. The following table compares the cost of running an always-on 10-node kafka.m5.4xlarge AWS MSK cluster vs. a Confluent Cloud serverless cluster with auto-scaling enabled:
| AWS MSK | Confluent Cloud | |||||
| Component | Price Dimension | Usage | Hourly Cost | Monthly Cost | Hourly Cost | Monthly Cost |
| Compute Capacity - provisioned broker nodes | Broker node per hour | 10 kafka.m5.4xlarge nodes ($1.68 per hour, per node) | $16.80 | $12,096 | N/A | N/A |
| Compute Capacity - eCKUs | eCKU per hour - Standard cluster ($0.75/hour) | 5 eCKUs average | N/A | N/A | $3.75 | $2,700 |
| Data In | MSK:$0.010 per GB, Confluent Cloud: $0.035 per GB | 25 MB/s = 64.8 TB per month | $0.90 | $648 | $3.15 | $2,268 |
| Data Out | MSK: $0.006 per GB, Confluent Cloud: $0.05 per GB | 25 MB/s = 64.8 TB per month | $0.54 | $389 | $4.50 | $3,240 |
| Data Stored | GB/month (MSK: $0.10, Confluent Cloud: $0.08) | 1TB | $0.14 | $100 | $0.11 | $80 |
| $18.38 | $13,233 | $11.51 | $8,288 | |||
With this setup, the cost of running a Confluent Cloud cluster is 37% lower compared to MSK. Even though Data In and Data Out cost is higher in Confluent (3.5x and 8.3x, respectively), the 4.5x higher compute capacity cost of an always-on Kafka cluster in this MSK setup compensates for this. It might be possible to get a similar performance in MSK with a smaller cluster size, but that would require a separate set of test executions. MSK also supports a Serverless implementation, which is a viable option in order to implement auto scaling and ensure the cluster has an optimal resource allocation based on its usage.
The following table compares the cost of running data ingestion in AWS Firehose, Confluent Tableflow and Starburst Galaxy, with usage that reflects the one incurred by the executed test scenarios (25 MB/s sent to Kafka cluster):
| AWS Firehose | Confluent Tableflow | Starburst | ||||||
| Component | Price Dimension | Usage | Hourly Cost | Monthly Cost | Hourly Cost | Monthly Cost | Hourly Cost | Monthly Cost |
| Data Ingestion | Ingestion, per GB Firehose: $0.045, Tableflow: $0.04, Starburst (0.01640 credits/hour per 1MB/s capacity. Enterprise plan is $0.75 per credit.) | 25MB/s = 64.8 TB per month | $4.05 | $2,916 | $3.60 | $2,592 | $0.31 | $221 |
| Starburst Data Transforms (schema conversion to Iceberg) | 0.3 credits per hour | Enterprise plan: $0.75 per credit. | N/A | N/A | N/A | N/A | $0.23 | $162 |
| S3 Data Storage (assume 1-month retention) | S3 Storage: $0.023 per GB/month | Data sent to Kafka clusters: 64.8 TB per month. Final storage based on compression rates: Firehose (-9% = 71TB per month), Tableflow (69% = 20 TB per month), Starburst (85% = 9TB per month) | $2.27 | $1,633 | $0.64 | $460 | $0.29 | $207 |
| Topic | Firehose: $0 per topic, Tableflow: $0.10 per topic/hour | 1 topic | N/A | N/A | $0.10 | $72 | N/A | N/A |
| $6.32 | $4,549 | $4.34 | $3,124 | $0.82 | $590 | |||
For this test, Starburst data ingestion cost was 87% lower compared to AWS Data Firehose and 81% lower compared to Confluent Tableflow (i.e. Data Firehose and Confluent Tableflow cost was 7.7x and 5.3x higher than Starburst, respectively). It is highly recommended to stop Starburst Galaxy’s live tables when not in use and to configure the right throughput capacity, in order to optimize Streaming Ingest fees.
Summary
Data Streaming is an essential component in many modern applications. It enables a wide variety of use cases, including critical steps required by AI solutions. Using Iceberg table format as a final destination for data streaming processes is a recommended best practice, given the benefits Iceberg delivers in terms of performance, scalability and data maintenance.
Both Confluent and Starburst support the launch and integration with AWS resources in the North Virginia region, which allowed for a consistent set of test scenarios that also included AWS MSK and AWS Data Firehose. Both Confluent and Starburst support integration with AWS resources using IAM Roles, which is a security best practice.
All tests were executed using the same dataset, which corresponded to the store_sales table that is part of the TPC-DS standard data benchmark. The total amount of time it took Starburst to ingest all data into Iceberg format and the records/second ingestion rate were 7x faster compared to Data Firehose, when ingesting from an MSK cluster. When ingesting data from Confluent Cloud, Starburst was also 7x faster compared to Confluent Tableflow for these metrics (total amount of time and records/second ingestion rate). Starburst records per second and data ingestion rates were very similar when ingesting from either AWS MSK or Confluent Cloud.
Considering 25MB/s as the maximum tested data production rate into a Kafka cluster, Starburst Data Ingestion cost was 87% lower compared to AWS Data Firehose and 81% lower compared to Confluent Tableflow (i.e. Data Firehose and Confluent Tableflow cost was 7.7x and 5.3x higher than Starburst, respectively). It is highly recommended to stop Starburst Galaxy’s live tables when not in use and to adjust the right throughput capacity, in order to optimize Streaming Ingest fees. Since each application has its own set of usage and configuration requirements, it is important to evaluate performance and cost as part of the early design and implementation stages.
Do you need help implementing or optimizing Data Streaming or Data Analytics solutions in the cloud?
I will help you find and implement the right Data Streaming and Data Analytics platform for your business needs and optimize your existing systems to make sure they deliver the right balance between performance and cost for your business. Click on the button below to schedule a free consultation or use the contact form.